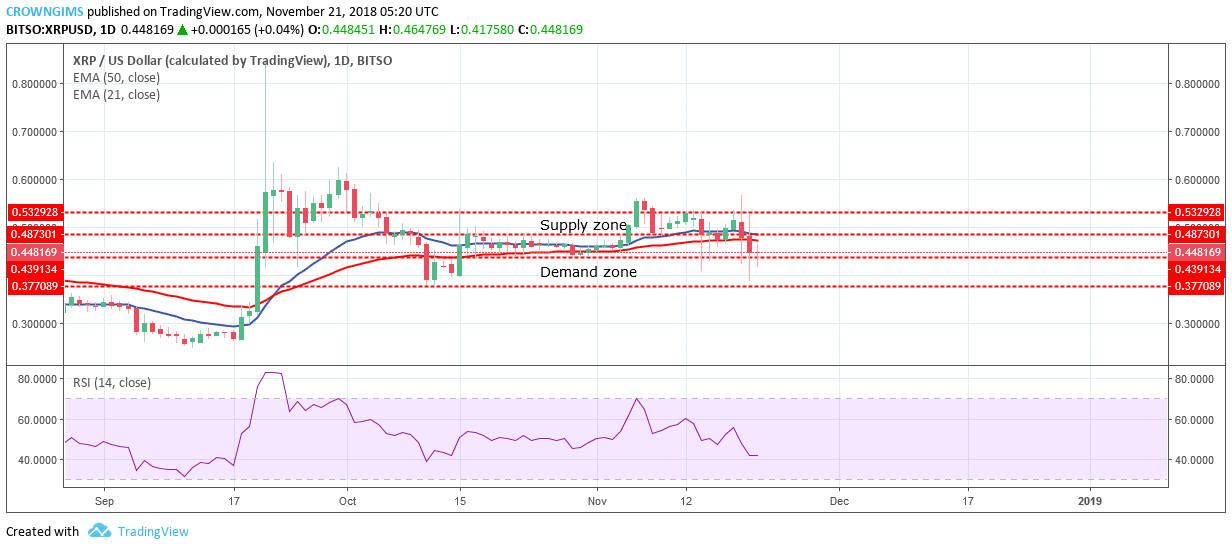
Supply levels: $0.48, $0.53, $0.57
Demand levels: $0.43, $0.37, $0.26The coin is ranging in its long-term outlook. The bulls tried last week to push the coin above the supply zone of $0.53 but it was rejected by the strong pressure of the bears; clearly noted on the chart with the upper longed wick bearish candle that pushed the XRP price down to the demand zone of $0.37 after the demand zones of $0.48, $0.43 was broken.
The bulls also rejected a further decrease of the XRP price. The bulls and the bears were struggling with each other on the XRP market and it has made it volatile. The candles have been opened and closed within the range of $0.53 and $0.43 price level.
XRP price is below 50-day EMA while 21-day EMA is above 50-day EMA parallel to each other indicates that consolidation is ongoing. Until a radical force push out XRP price from the price range, consolidation is still in place. If the bulls break the upper price range and maintain the momentum, the XRP price will experience uptrend movement. Likewise, if the bears break the lower price range and maintain the momentum XRP price will experience downtrend.
.
XRP/USD Price Medium-term Trend: Bearish
On the 4-H chart, XRP is bearish. The cryptocurrency is bearish as the bulls could not break the supply zone of $0.53. The bears took over the market and push it to the demand zone of $0.43.
The XRP price is below the 21-day and 50-day EMA which indicates bearish movement. The 21-day EMA has crossed the 50-day EMA downside as the confirmation of the bearish movement. The RSI is at the 40 levels point to the south, means that there are possibilities for further downward movement.
To learn more about XRP coin, Ripple company and their innovative solutions, please check out our awesome guide.
Azeez Mustapha is a specialist in Computer Studies (including DTP), Forex and Crypto trading professional. Being expert technical and currency analyst, as well as experienced fund manager and author of several books, Azeez places strong focus on crypto market studies conducting comprehensive price analyses and sharing forecasts of presumptive market trends.

 The coin is ranging in its long-term outlook. The bulls tried last week to push the coin above the supply zone of $0.53 but it was rejected by the strong pressure of the bears; clearly noted on the chart with the upper longed wick bearish candle that pushed the XRP price down to the demand zone of $0.37 after the demand zones of $0.48, $0.43 was broken.
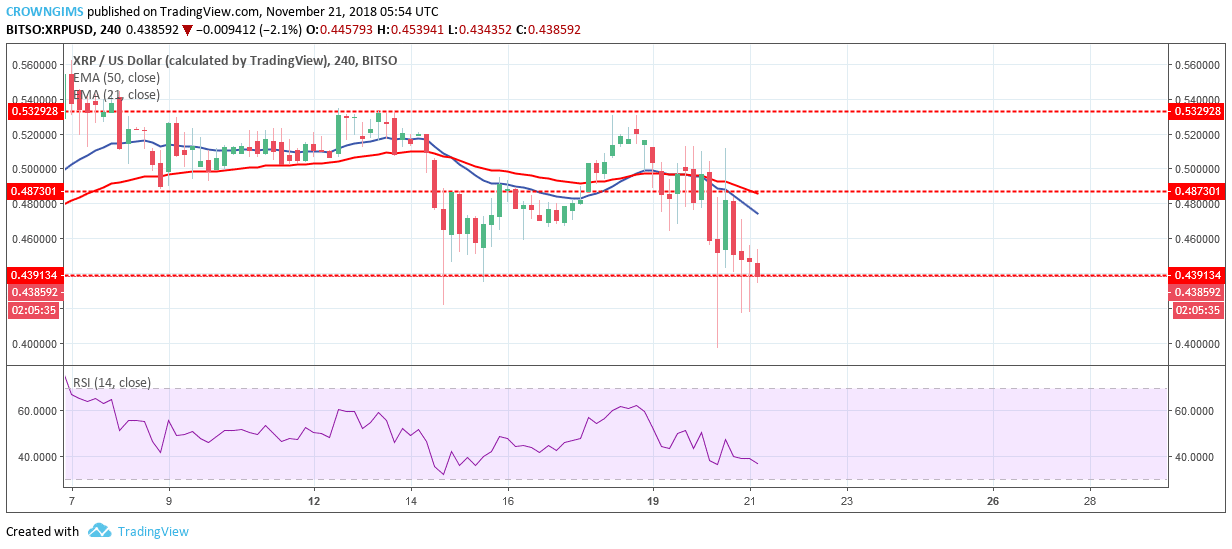 On the 4-H chart, XRP is bearish. The cryptocurrency is bearish as the bulls could not break the supply zone of $0.53. The bears took over the market and push it to the demand zone of $0.43.