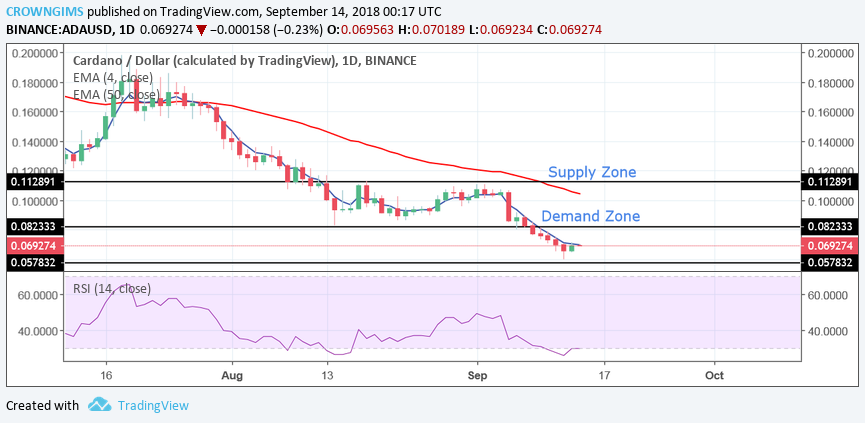
ADA/USD moved towards south last week with the formation of massive bearish candles on the daily chart. It headed towards lower trend line and broke the last week strong demand Zone of $0.08 as it was forecasted last week. The coin continued its bearish movement in its long-term. Currently, the price is trending downwardly towards the level that it was last year November.
The EMA 4-day still remains below the 50-day EMA and ADA/USD remains below the 4-day EMA. On the daily chart, more bearish candles are formed, which indicate the possibility of further downside movement. There is a probability that the price may retest the supply zone of $0.08 as the bullish inside bar candle formed at the demand zone of $0.05.
The RSI 14 is at the oversold below 20-level pointing towards the north. There may be upward movement next week should the demand zone of $0.05 holds.
ADA/USD Medium-term Trend: Bearish
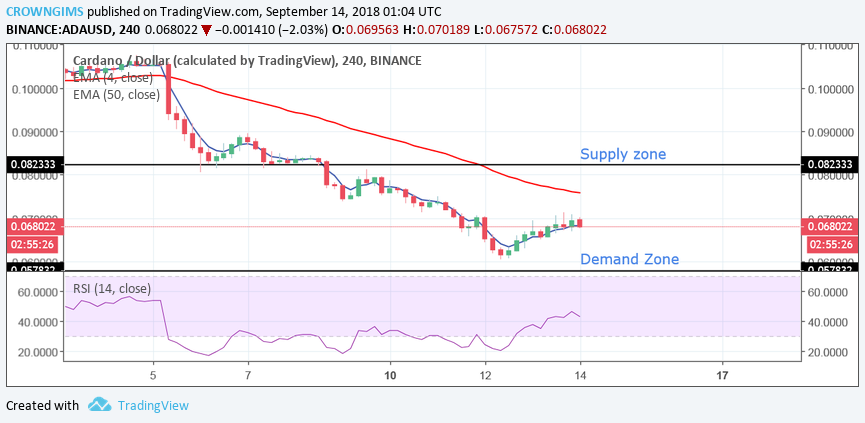
Cardano on the 4-H chart is also bearish. Last week, the bullish movement of the coin was interrupted by the formation of massive bearish candles. The price reduces towards the demand zone of $0.08 and broke the demand zone downwardly, exposed the price to another demand zone of $0.05. The price had a rejection which ended up with the formation of the bullish candles on 4-H chart.
The price was below 4-day EMA moved far away from 50-day EMA downside. At present, the price is returning towards the north with the formation of more bullish candles. The price may retest the supply zone of $0.08.
The RSI 14 is above 40 level with the signal line pointing upwards. There is a probability for the coin to retest the supply zone of $0.08 before break out. Should the supply zone of $0.08 broken an uptrend movement will be triggered. Traders should remember that trend is our friend.
Disclaimer: The views and opinions expressed here do not reflect that of Coinspeaker.com and do not constitute financial advice. Always do your own research. The charts for the analysis are provided by TradingView
Azeez Mustapha is a specialist in Computer Studies (including DTP), Forex and Crypto trading professional. Being expert technical and currency analyst, as well as experienced fund manager and author of several books, Azeez places strong focus on crypto market studies conducting comprehensive price analyses and sharing forecasts of presumptive market trends.