ETH sees increased investor interest with a 40% jump in 24-hour trading volume.
Large ETH withdrawals from exchanges by new wallets suggest strategic accumulation.
Whales have collectively added over 1 million ETH in the past month, indicating strong institutional confidence.
Ethereum ETH$3 75824h volatility:3.2%Market cap:$453.33 BVol. 24h:$54.52 B
has been gaining momentum, now trading at $2,639 after rising 1.5% in the past 24 hours. The 24-hour trading volume has jumped 40% to $23.72 billion, suggesting rising investor interest.
Notably, earlier on May 28, two newly created wallets withdrew a combined 4,838 ETH (worth roughly $13 million) from Kraken.
Another 2 newly created wallets withdrew 4,838 $ETH ($13M) from #Kraken 6 hours ago.
This follows a similar activity seen on May 27, when four new wallets pulled out 4,392.6 ETH (worth around $11.7 million) from OKX. Such consistent exchange outflows indicate growing investor preference for self-custody and long-term holding strategies.
Meanwhile, whales have accumulated over 1 million ETH in the past month, signaling strong institutional confidence.
Ether ETFs have also recorded sustained inflows recently. Data from SoSoValue shows that over the last seven trading days, these funds have attracted a cumulative $310 million.
ETH Price Outlook
Once underperforming compared to the broader crypto market, Ether has seen a notable reversal. It has surged 46% over the last 30 days, adding nearly $100 billion to its market capitalization, which now stands around $318 billion.
Despite the rally, popular analyst Michael Van de Poppe believes a major breakout is still ahead. He notes that ETH is now testing a crucial resistance range between $2,627 and $2,850.
— Michaël van de Poppe (@CryptoMichNL) May 28, 2025
Van de Poppe suggests that a successful breakout above this resistance could send Ethereum to revisit or even exceed its all-time high of $4,891.
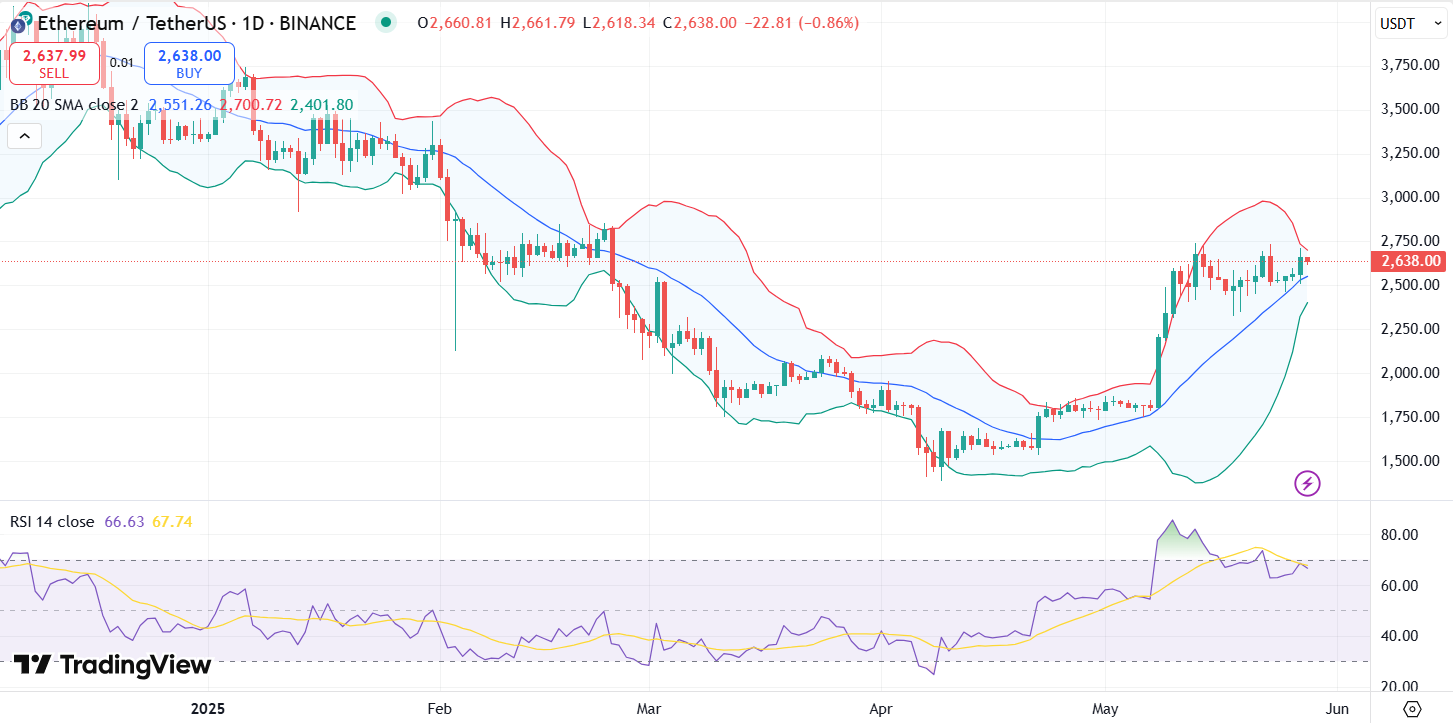
On the daily ETH chart, the price is approaching the upper boundary of Bollinger Bands around $2,730. The mid band (20-day SMA) is acting as short-term bullish support for the second-largest cryptocurrency.
ETH price chart with RSI and Bollinger Bands | Source: TradingView
The RSI is nearing overbought territory but still leaves room for upward movement before signaling exhaustion. A break above the $2,850 resistance could confirm the bullish scenario, potentially leading ETH to $3,000.
Well-followed trader on X Crypto Fella remarked that he wouldn’t be surprised if Ether touched $2,900 this week.
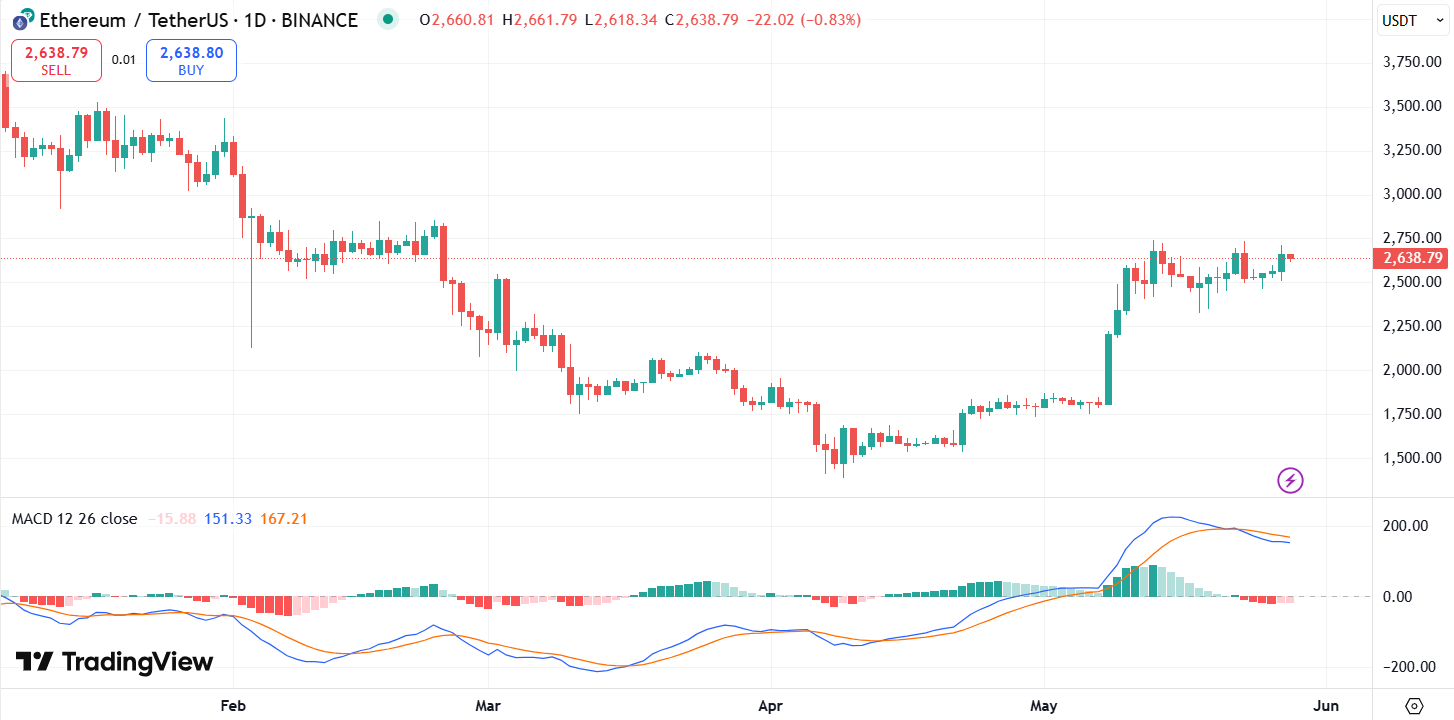
ETH price chart with RSI and Bollinger Bands | Source: TradingView
Meanwhile, the MACD histogram has flattened, and although the signal line remains above the MACD line, the gap is narrowing. This hints at a possible trend shift or brief rally ahead.
Disclaimer: Coinspeaker is committed to providing unbiased and transparent reporting. This article aims to deliver accurate and timely information but should not be taken as financial or investment advice. Since market conditions can change rapidly, we encourage you to verify information on your own and consult with a professional before making any decisions based on this content.
A crypto journalist with over 5 years of experience in the industry, Parth has worked with major media outlets in the crypto and finance world, gathering experience and expertise in the space after surviving bear and bull markets over the years. Parth is also an author of 4 self-published books.