
Author
staff writer
The negative shift suggests a weakening demand for Bitcoin in the US, coinciding with slowed inflows into spot ETFs and a record outflow from Grayscale’s ETF.
 Edited by Kseniia Klichova
Updated
4 mins read
Edited by Kseniia Klichova
Updated
4 mins read

Bitcoin experienced a sharp decline, falling below the $63,000 threshold, catalyzing over $134 million in long-position liquidations. This sudden downturn reflects a broader market volatility, with Bitcoin price plummeting over 6% in a single day.
The impact was not confined to Bitcoin alone. Ethereum and Solana also faced significant losses, with Ether dropping 9.5% and Soalana over 12%. The total market saw over $515 million in total liquidations across various exchanges.
The market’s sentiment took a further hit as Bitcoin slumped, leading to over $440 million in losses for futures traders. This downturn prompted a reevaluation of Bitcoin’s short-term price targets, with some traders forecasting a potential fall to $55,000. This projection comes amidst record-high outflows from Grayscale’s GBTC and a net market outflow, pointing to a cautious or bearish outlook from investors. Bitcoin spot ETFs experienced record inflows, yet the trend began to slow down.
Bitcoin ETF Flow – 15 March 2024
All data in. Total net inflow of $198.8m for the day.
Table from @FarsideUK pic.twitter.com/QK69AmHz1J
— BitMEX Research (@BitMEXResearch) March 16, 2024
According to 10x Research, Bitcoin’s price, which had surged to a new all-time high near $70,000 due to significant inflows past week, but currently facing a sharp decline. The current price correction can be attributed to reduced net inflows during the past weekend. Bitcoin’s immediate future price action will heavily depend on the ETF inflows in the following days, with a potential continuation of the correction if these inflows are disappointing. Despite the risk of a deeper correction, the overall sentiment for Bitcoin’s bull market remains positive, provided BTC can sustain a recovery above $70,000.
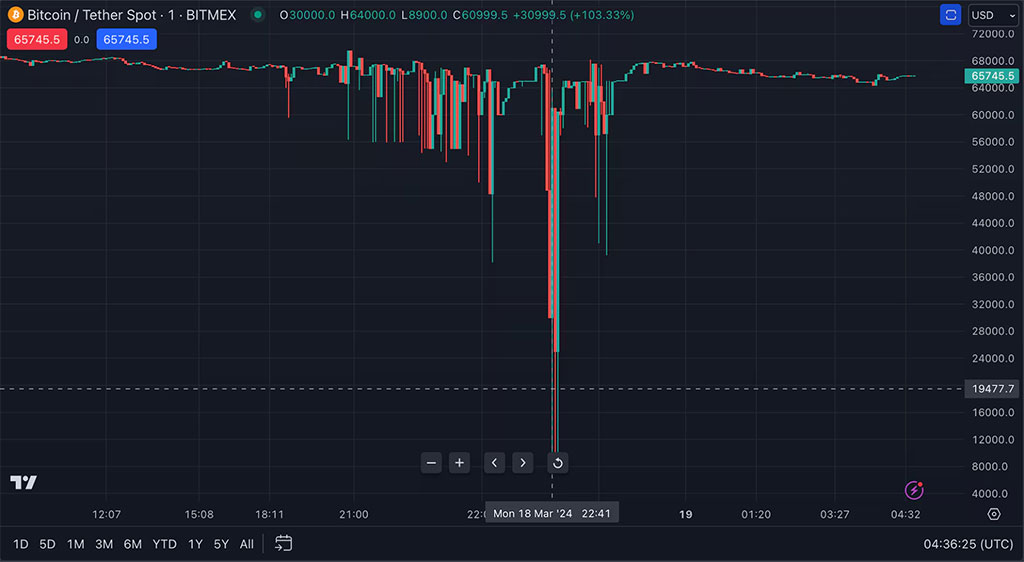
Photo: TradingView
Bitcoin (BTC) experienced a sudden and dramatic price drop on the BitMEX exchange.his unexpected event occurred late on a Monday, when Bitcoin’s price dropped dramatically to $8,900 on the XBT/USD spot market, while the global average price of Bitcoin was around $67,400. This price level was the lowest since early 2020.
Someone just dumped 400+ BTC over 2 hours in 10-50 BTC clips on the XBTUSDT pair on Bitmex eating 30%+ slippage. They must've lost $4m+ at least. pic.twitter.com/g64NRQ4h5a
— syq (@syq) March 18, 2024
However, the crash was short-lived, as prices quickly rebounded to $67,000 within minutes. Social media speculation suggests that the crash was triggered by a whale selling over 850 BTC ($55.49 million), causing a significant drop in the XBT/USDT spot pair to $8,900.
Despite the turmoil in the spot market, BitMEX’s billion-dollar derivatives markets remained stable. BitMEX has announced that it is investigating the large sell orders that led to this flash crash and assured that its trading platform is operating normally with all funds being safe.
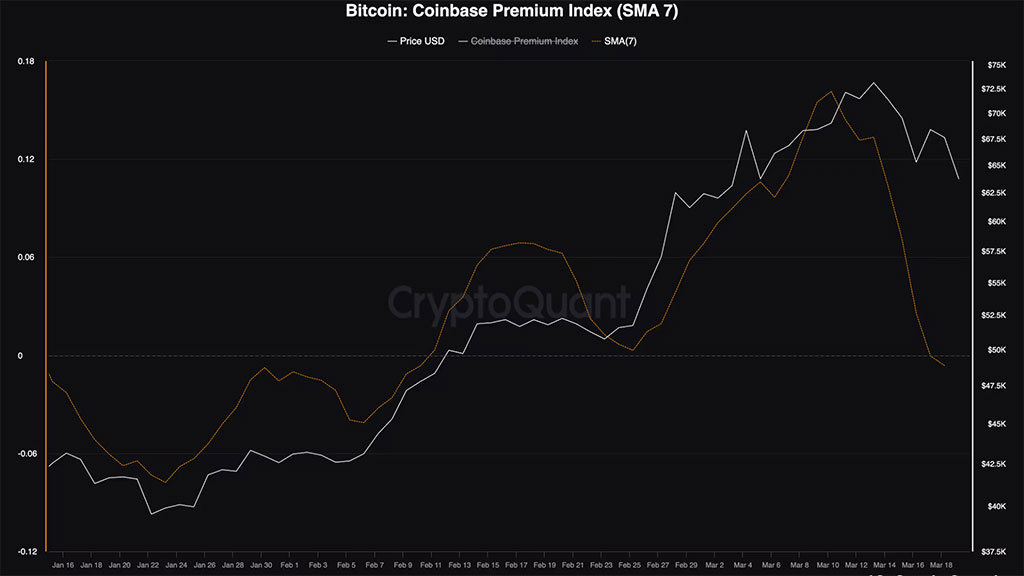
Photo: CryptoQuant
A critical shift was observed in the buying pressure from US investors, as indicated by the so-called Coinbase premium turning negative. This indicator, which had surged to a 12-month high during Bitcoin’s ascent, reflects the price spread between Coinbase and Binance. This signifies that Bitcoin is currently being traded at a lower price on Coinbase, a platform acting as the trustee for eight out of the eleven spot Exchange-Traded Funds (ETFs) introduced in the United States two months prior.
The negative shift suggests a weakening demand for Bitcoin in the US, coinciding with slowed inflows into spot ETFs and a record outflow from Grayscale’s ETF. This development is a clear signal of changing investor sentiment, potentially forecasting a deeper slide in Bitcoin prices if ETF inflows do not pick up.
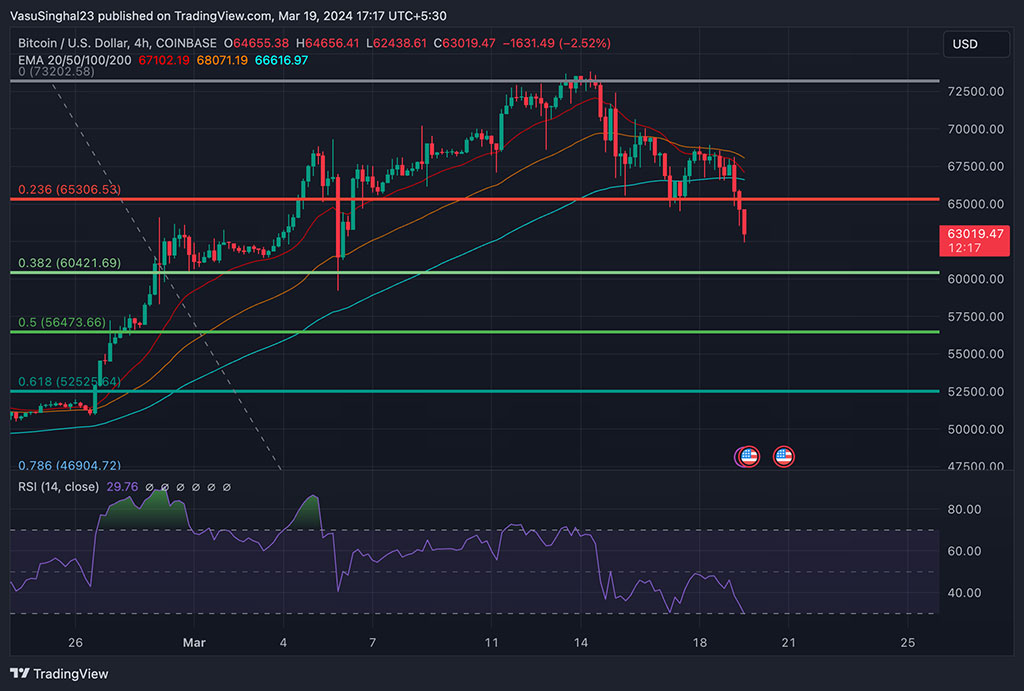
Photo: TradingView
The chart includes several technical analysis indicators. The price is moving below the Exponential Moving Averages (EMAs) of 20, 50, 100, and 200 periods, which are plotted as orange, blue, red, and green lines, respectively. This generally suggests a bearish outlook as the price is positioned below these key dynamic resistance levels.
The Fibonacci retracement levels drawn from a recent swing low to a high suggest potential areas of support or resistance. As of the latest data point, the price has breached the 0.382 level at approximately $60,421.69 and is approaching the 0.5 level at $56,473.66. This could indicate potential support or a reversal zone where buyers might show interest.
The Relative Strength Index (RSI) is included at the bottom of the chart. It is currently below the 40 mark, which suggests bearish momentum and that the asset might be in oversold territory.
Overall, the market sentiment appears to be bearish in the short term, as indicated by the price’s position relative to the EMAs and the RSI indicator. However, the Fibonacci levels might provide areas where the price action could stabilize or reverse, depending on the market’s reaction to these zones.
Disclaimer: Coinspeaker is committed to providing unbiased and transparent reporting. This article aims to deliver accurate and timely information but should not be taken as financial or investment advice. Since market conditions can change rapidly, we encourage you to verify information on your own and consult with a professional before making any decisions based on this content.


