Bitcoin Price Analysis: BTC/USD Trends of October 31–November 6, 2018
Should the bears increase their momentum and break down the accumulation territory of $6,137, Bitcoin will head towards the lower accumulation territory of $6,032.
By Azeez Mustapha
Updated
2 mins readPhoto: QuoteInspector
Key Highlights:
Consolidation is ongoing;
the Bitcoin price broke out of the accumulation territory;
there is a probability of the bulls taking over the BTC market.
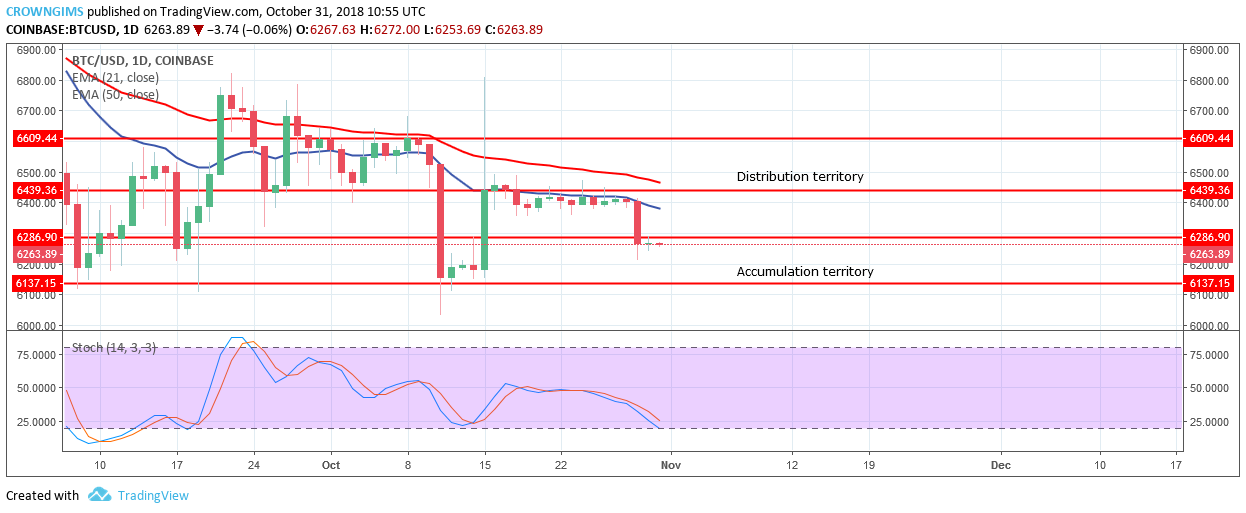
BTC/USD Long-term Trend: Bearish
Distribution Territories: $6,286, $6,439, $6,609
Accumulation Territories: $6,137, $6,032, $5,948BTC is in bearish trend on the long-term outlook. BTC was consolidating for more than one week. It started shortly after the fall from the distribution territory of $6,818 to the accumulation territory of $6,439. The pair was trading between the range bound of $6,439 and the former accumulation territory of $6,286.
The bears gained momentum on October 29; the pair was pushed to the south with the formation of a strong bearish candle that broke the former accumulation territory of $6,286. The bears are in control of the market. The first candle on the daily chart is bullish indicating that the coin may continue in its bearish movement as accumulation territory of $6,137 may be its target.
Should the bears increase their momentum and break down the accumulation territory of $6,137, the coin will head towards the lower accumulation territory of $6,032. In case the $6,137 level holds the price will bounce to the north and the bull will take over. Also, traders can place long trade setup at the level.
BTC/USD Medium-term Trend: Bearish
BTC/USD is bearish in its medium-term outlook. The coin broke out of the consolidation mode on October 29 with high pressure from the bears. This confirmed with the formation of strong bearish candles that broke former accumulation territory of $6286 downside and the coin started consolidating.
Presently, the price is below 21-day EMA and 50-day EMA and the Stochastic Oscillator is at the oversold level with its signal line parallel without direction which connotes consolidation is ongoing. There is a probability that the coin will continue its bearish movement.
Azeez Mustapha is a specialist in Computer Studies (including DTP), Forex and Crypto trading professional. Being expert technical and currency analyst, as well as experienced fund manager and author of several books, Azeez places strong focus on crypto market studies conducting comprehensive price analyses and sharing forecasts of presumptive market trends.

 BTC is in bearish trend on the long-term outlook. BTC was consolidating for more than one week. It started shortly after the fall from the distribution territory of $6,818 to the accumulation territory of $6,439. The pair was trading between the range bound of $6,439 and the former accumulation territory of $6,286.
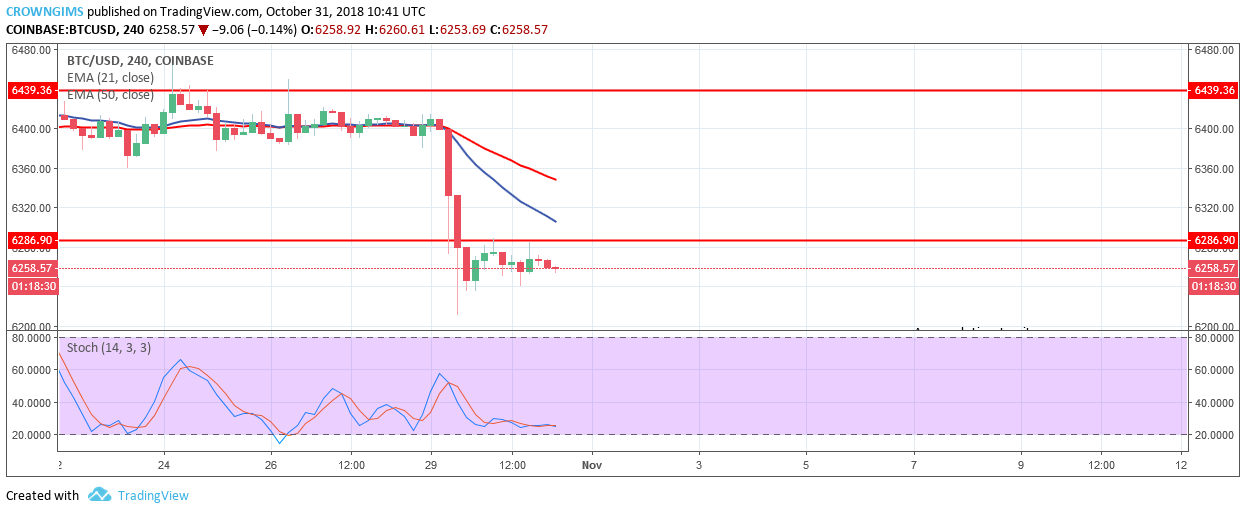 BTC/USD is bearish in its medium-term outlook. The coin broke out of the consolidation mode on October 29 with high pressure from the bears. This confirmed with the formation of strong bearish candles that broke former accumulation territory of $6286 downside and the coin started consolidating.


