Bitcoin Price Analysis: BTC/USD Trends of February 04–10, 2019
Further declination of Bitcoin price depends on the Bears’ pressure as a new daily bearish candle is emerging and this may push the coin to bottom at the demand level of $3,247.
further price declination is anticipated in the BTC market.
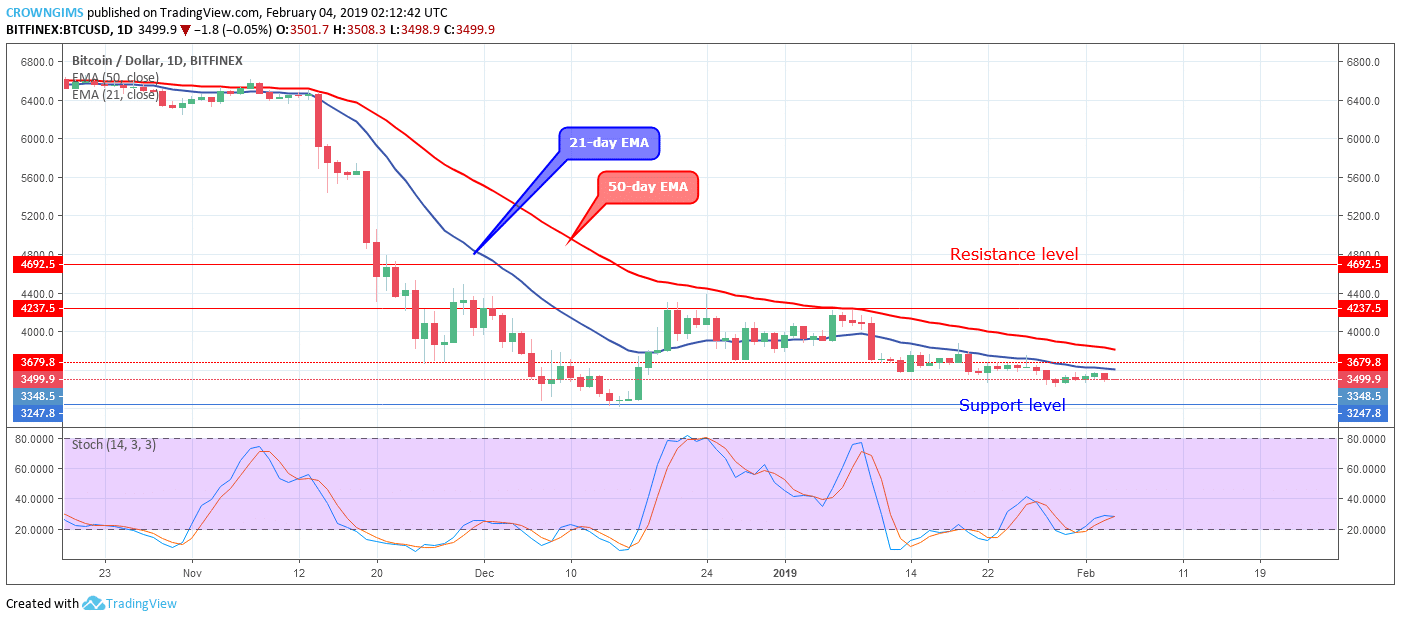
BTC/USD Long-term Trend: Bearish
Resistance levels: $3,679, $4,237, $4,692
Support levels: $3,247, $2,765, $1,95BTC/USD is in a bearish trend on the long-term outlook. All attempts made by the bulls to break up the resistance level of $3,679 were proof abortive by the dynamic resistance and support 21-day EMA. This has been acting as a barrier to the uptrend movement.
The bears continue dominating the BTC market but at a slow momentum. A daily bearish candle formed on January 28 pushed the coin slightly down below the upper week consolidation level but unable to reach the previous low of $3,247 support level and shortly after that, the coin commenced another phase of consolidation.
The two EMAs were steadily sloppy down on the daily chart following the trend and Bitcoin price remains under the 21-day EMA and 50-day EMA as a bearish trend indication. The Stochastic Oscillator period 14 is above 20 levels with the signal lines pointing to the south connotes sell signal. Further declination of Bitcoin price depends on the Bears’ pressure as a new daily bearish candle is emerging and this may push the coin to bottom at the demand level of $3,247. Traders may place buy limit order at $3,247 price level as this mark may serve as a turning point for the BTC price.
BTCUSD Medium-term Trend: Bearish
BTC/USD is still on a bearish trend on the medium-term outlook. The inside bar bearish candle pattern formed on the 26th of January implies that the bears were coming into the BTC market with full force and the BTC price decreased and bottomed around $3,247. The BTC price made the mark as its turning point. The inside bar bullish candle formed on January 29 alerted the market of the bulls’ arrival which made the coin to rally upward towards the 50-day EMA which serves as a pullback for the BTC price.
The Stochastic Oscillator period 14 is at 20 levels with its signal line pointing down connotes sell signal. In addition, Bitcoin price is still trading below the two EMAs indicates that the BTC may range downward towards $3,247 price level.
Azeez Mustapha is a specialist in Computer Studies (including DTP), Forex and Crypto trading professional. Being expert technical and currency analyst, as well as experienced fund manager and author of several books, Azeez places strong focus on crypto market studies conducting comprehensive price analyses and sharing forecasts of presumptive market trends.

 BTC/USD is in a bearish trend on the long-term outlook. All attempts made by the bulls to break up the resistance level of $3,679 were proof abortive by the dynamic resistance and support 21-day EMA. This has been acting as a barrier to the uptrend movement.
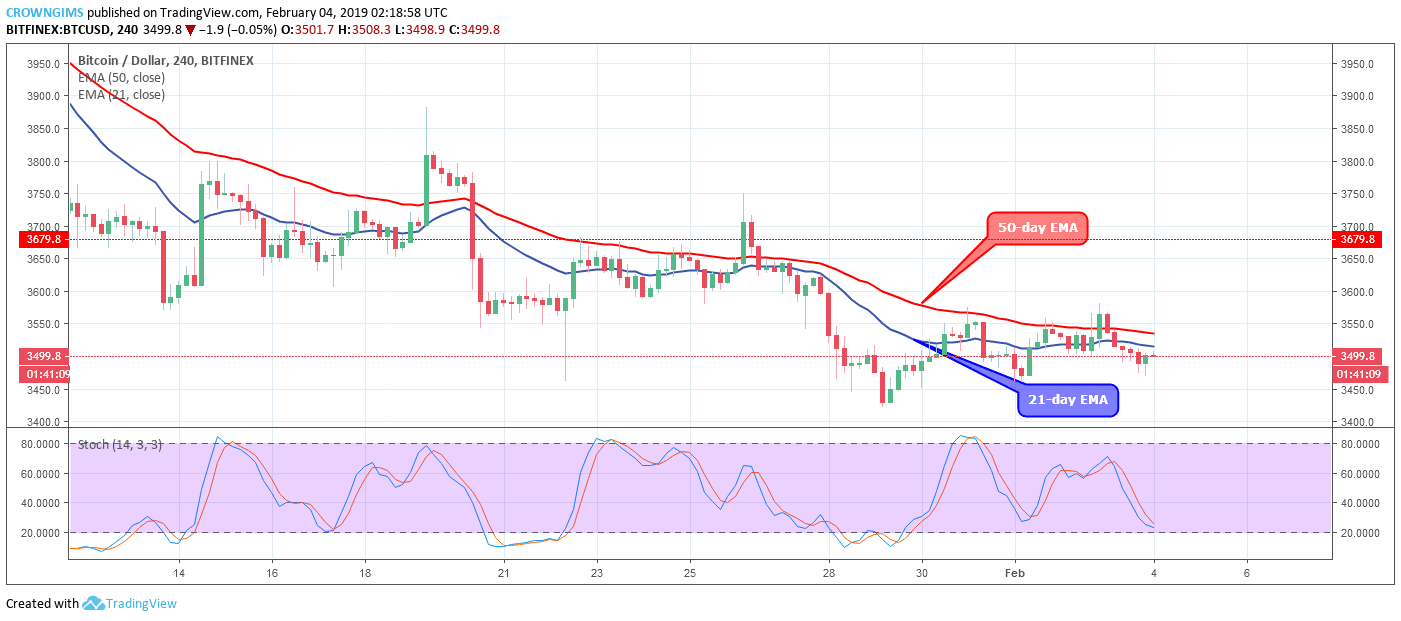 BTC/USD is still on a bearish trend on the medium-term outlook. The inside bar bearish candle pattern formed on the 26th of January implies that the bears were coming into the BTC market with full force and the BTC price decreased and bottomed around $3,247. The BTC price made the mark as its turning point. The inside bar bullish candle formed on January 29 alerted the market of the bulls’ arrival which made the coin to rally upward towards the 50-day EMA which serves as a pullback for the BTC price.


