Cardano Price Analysis: ADA/USD Trends of February 01–07, 2019
Cardano price may find its support at the previous low of $0.030 in case the bears maintain or gain more pressure to drive the coin downward but bearish momentum failure may lead to a change of trend direction.
By Azeez Mustapha
Updated
2 mins readPhoto: Shutterstock
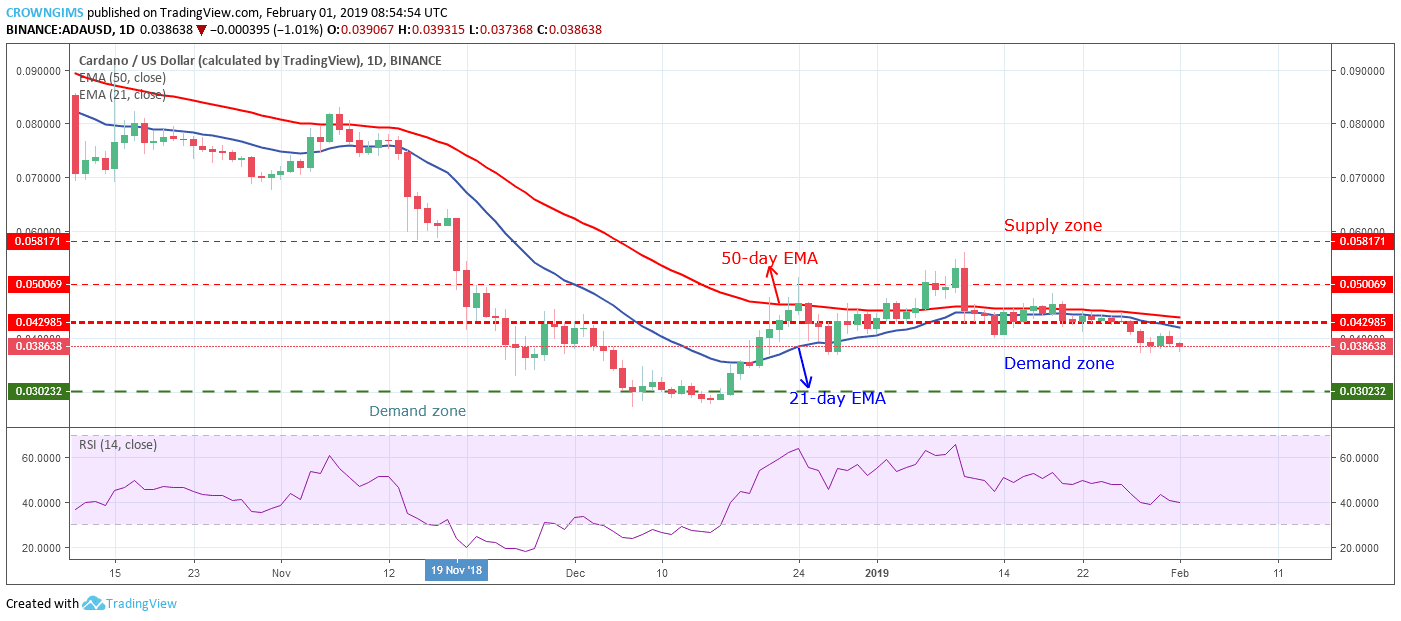
Supply Zones: $0.042, $0.050, $0.058
Demand Zones: $0.030, $0.021, $0.011ADA/USD is on the bearish trend on the long-term outlook. The bears defended the supply zone of $0.050 and the coin broke out of the ranging zone which lasted for almost two weeks. The bears gained enough momentum to break down the former demand zone of $0.042 last week.
ADA price decreased towards the $0.030 price level; that is Cardano price is currently facing another significant demand zone which may require higher momentum to penetrate. Presently, the bears were in control of the Cardano market.
The two dynamic resistance and support (21-day EMA and 50-Day EMA) are above the ADA price as a sign of a bearish trend with the two EMAs bending down to follow the trend. The Relative Strength Index is at 40 levels and the signal line pointing to the south indicates a high probability of bearish trend continuation.
Cardano price may find its support at the previous low of $0.030 in case the bears maintain or gain more pressure to drive the coin downward but bearish momentum failure may lead to a change of trend direction.
ADA/USD Price Medium-term Trend: Ranging
On the medium-term outlook, ADA/USD is on the bearish trend. The Bears prevailed over the bulls last week as both the bears and the bulls were unable to make the coin rally before January 26. The bearish “inside bar” candle pattern formed on January 26 is an indication that the bears gained higher momentum to drive the market. $0.042 price level were broken downside and Cardano price declined towards $0.030 but unable to reach the mark before it was retraced towards the two dynamic support and resistance.
ADA price is trading below the 21-day EMA and 50-day EMA. The Relative Strength Index period 14 is at 40 levels with signal lines pointing up which indicates the buy signal.
Azeez Mustapha is a specialist in Computer Studies (including DTP), Forex and Crypto trading professional. Being expert technical and currency analyst, as well as experienced fund manager and author of several books, Azeez places strong focus on crypto market studies conducting comprehensive price analyses and sharing forecasts of presumptive market trends.

 ADA/USD is on the bearish trend on the long-term outlook. The bears defended the supply zone of $0.050 and the coin broke out of the ranging zone which lasted for almost two weeks. The bears gained enough momentum to break down the former demand zone of $0.042 last week.
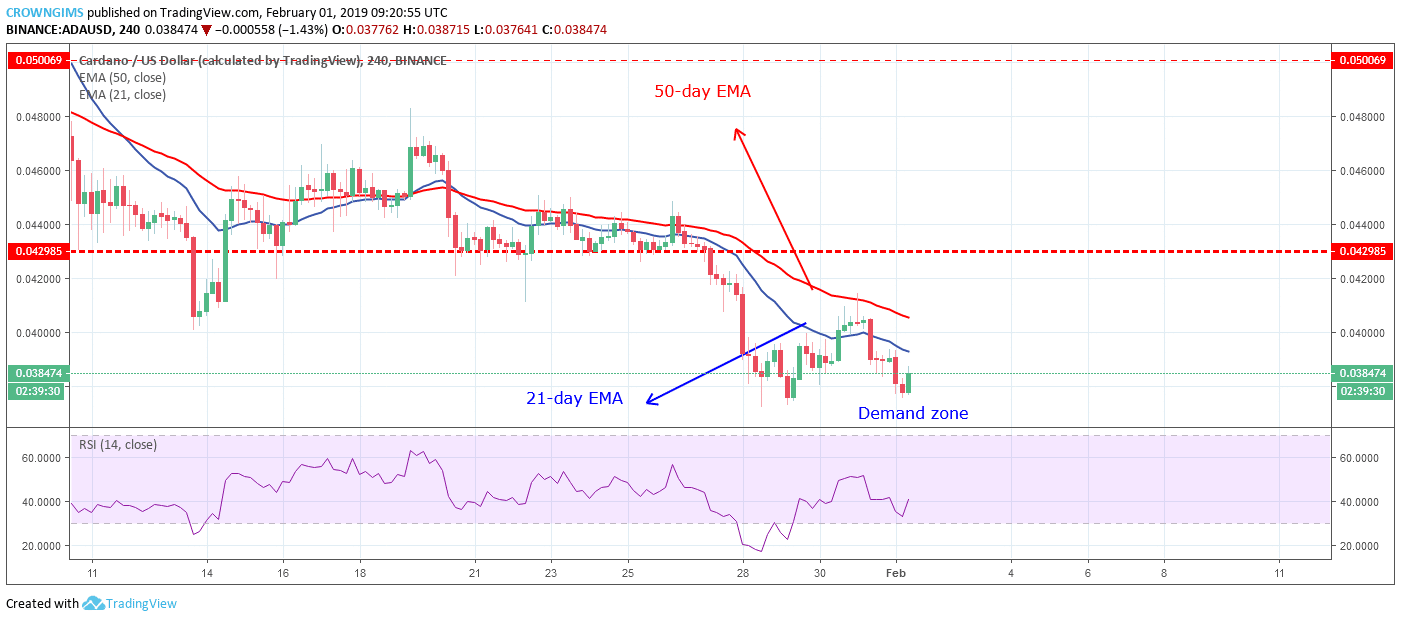 On the medium-term outlook, ADA/USD is on the bearish trend. The Bears prevailed over the bulls last week as both the bears and the bulls were unable to make the coin rally before January 26. The bearish “inside bar” candle pattern formed on January 26 is an indication that the bears gained higher momentum to drive the market. $0.042 price level were broken downside and Cardano price declined towards $0.030 but unable to reach the mark before it was retraced towards the two dynamic support and resistance.