Cardano Price Analysis: ADA/USD Trends of November 2–8, 2018
The bulls are trying to defend $0.069 demand zone which will make the Cardano price to bounce and rally to the north towards the supply zone of $0.075.
By Azeez Mustapha
Updated
2 mins readPhoto: Trung Kien / Flickr
Key Highlights:
There could be a further decrease in Cardano price;
traders should look out for sell stops to initiate short trades.
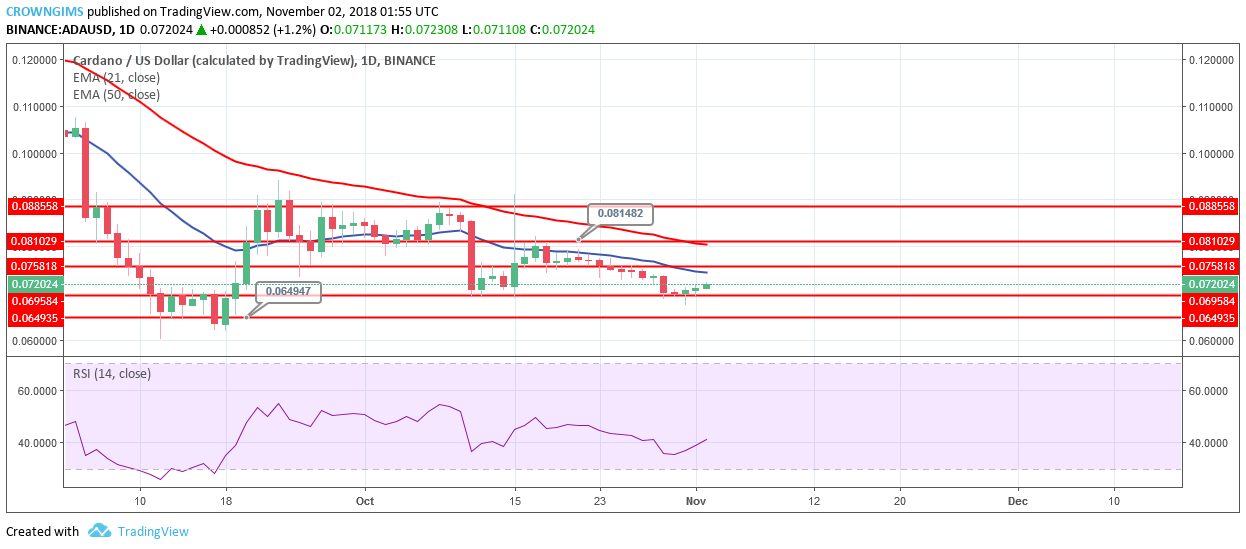
ADA/USD Price Long-term Trend: Bearish
Supply Zones: $0.075, $0.081, $0.088
Demand Zones: $0.069, $0.064, $0.060Cardano price continues falling on the long-term outlook. It was a bearish trend market for Cardano last week. The bears hold tight to the control of ADA market since October 18, when the continuation of uptrend movement was rejected by the bears’ strong momentum with a bearish engulfing candle formed at the supply zone of $0.081 and more bearish candles were formed that made ADA price to break the former support zone of $0.075 and landed on the demand zone of $0.069. The bulls are rejecting further decrease in ADA price by the formation of bullish pin bar at the demand zone of $0.069.
The bulls are trying to defend $0.069 demand zone which will make the ADA price to bounce and rally to the north towards the supply zone of $0.075, if this zone is broken by the bulls ADA price may rise to the $0.081 supply zone. Should bears defend $0.075 supply zone, traders can look for an opportunity to place sell stop order to go short because ADA price may resume its downtrend which may break demand zone of $0.069 down to Demand zone of $0.064 as the target.
The price is below 21-day EMA and the 50-day EMA which indicates that downtrend is ongoing. However, the RSI is at 40-level pointing towards the north which indicates that there are possibilities for upward movement.
ADA/USD Price Medium-term Trend: Bearish
On the 4-H chart, Cardano is still in bearish trend. On October 31, the bears pushed ADA price to the demand zone of $0.069, broke it downside but the bear interrupted the movement.
In case the demand zone of $0.069 holds, the price will bounce to the north and break the strong supply zone of $0.075, ADA will resume its uptrend movement towards the supply zone of $0.081.
ADA price is below 21-day EMA and 50-day EMA, the two EMAs are a distance from each other which indicates downtrend is ongoing.
Nonetheless, the RSI period 14 is above 50levels with signal lines point to the north, which indicates buy signal which may be a price retracement.
Azeez Mustapha is a specialist in Computer Studies (including DTP), Forex and Crypto trading professional. Being expert technical and currency analyst, as well as experienced fund manager and author of several books, Azeez places strong focus on crypto market studies conducting comprehensive price analyses and sharing forecasts of presumptive market trends.

 Cardano price continues falling on the long-term outlook. It was a bearish trend market for Cardano last week. The bears hold tight to the control of ADA market since October 18, when the continuation of uptrend movement was rejected by the bears’ strong momentum with a bearish engulfing candle formed at the supply zone of $0.081 and more bearish candles were formed that made ADA price to break the former support zone of $0.075 and landed on the demand zone of $0.069. The bulls are rejecting further decrease in ADA price by the formation of bullish pin bar at the demand zone of $0.069.
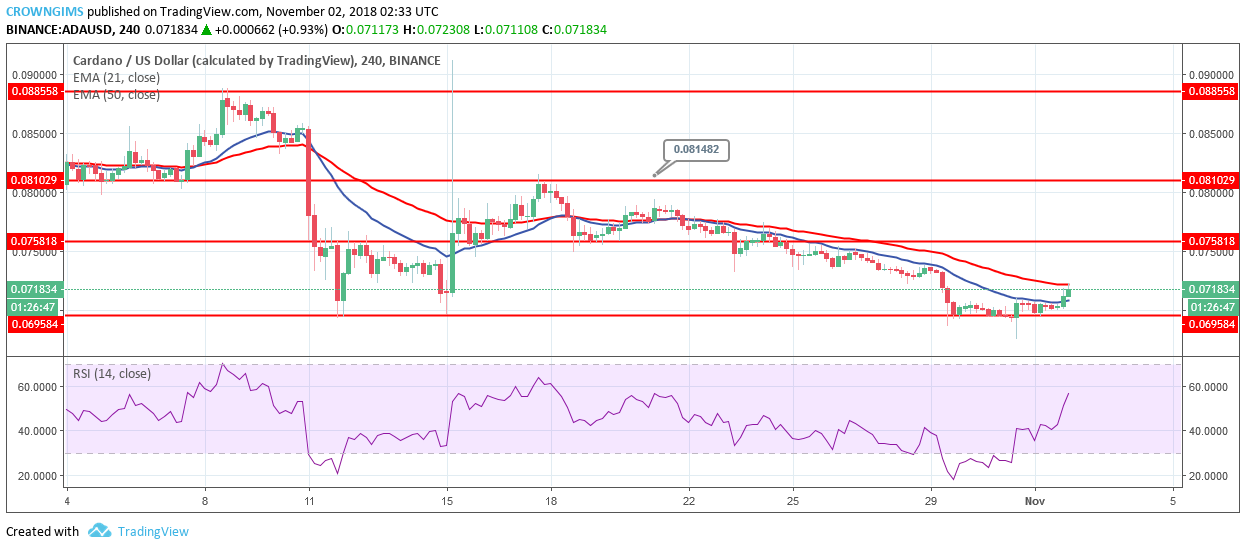 On the 4-H chart, Cardano is still in bearish trend. On October 31, the bears pushed ADA price to the demand zone of $0.069, broke it downside but the bear interrupted the movement.