Dmitriy Gurkovskiy, a senior analyst at foreign exchange broker RoboForex, provides his vision of the possible tendencies in price changes for Bitcoin as well as for other major cryptos.
Cryptocurrencies keep growing steadily, breaking away level after level. The growth of the Bitcoin is almost too aggressive, however, it remains inside a descending channel, and a test of its upper border may provoke a bounce, followed by another declining wave. For a good bullish trend to resume in the BTC, it is vital to see a breakaway of $8,500, in which case the buyers will easily send the price to the next important resistance level. Other assets are also aiming at further growth. We can see descending patterns being canceled, and most often such a picture precedes a reversal.
Bitcoin
On D1, BTC/USD has managed to break away the Moving Average, which indicates strong pressure from the buyers. The upper border of the descending channel is near $8,400-8,500. When this price will test this area, it may bounce off and try to decline to $6,385. A strong signal confirming this movement will be a test of the resistance line on the RSI. The scenario will be canceled if the Bitcoin grows significantly and secure above $9,000, which will mean a breakaway of the upper border of the descending channel and further growth to $10,455.
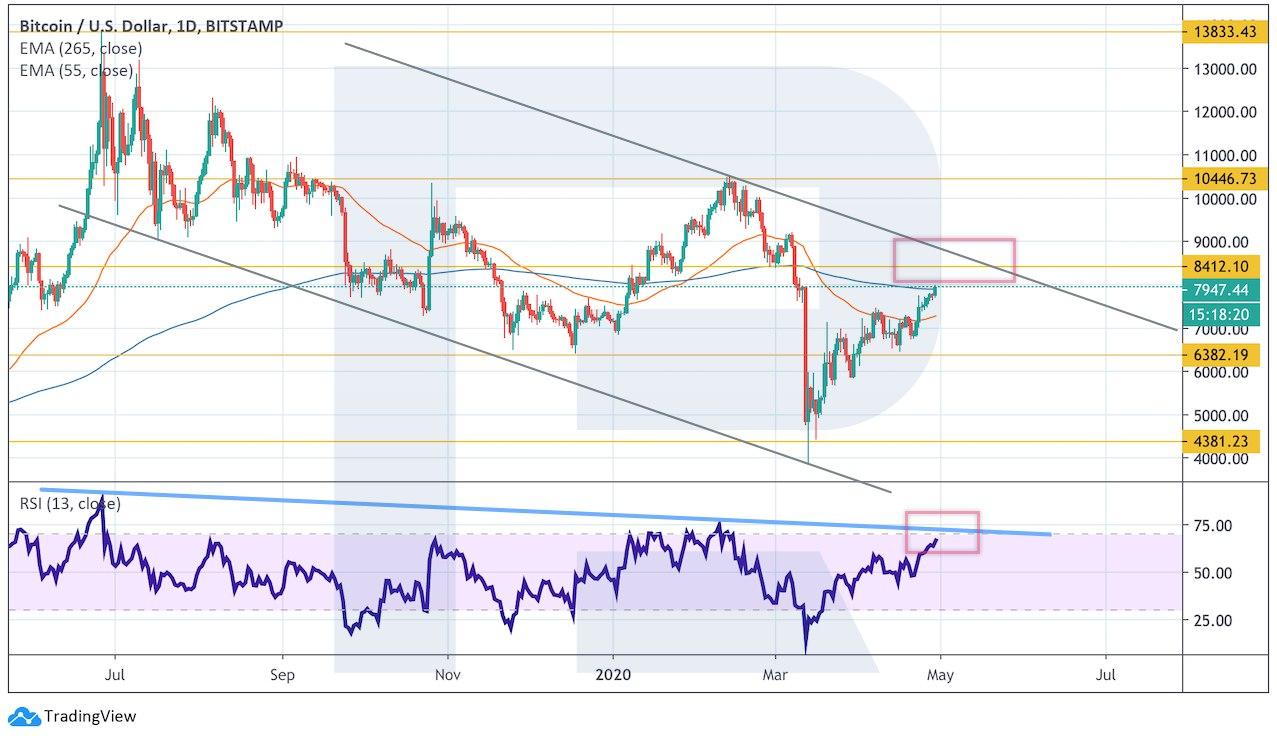
Photo: Roboforex / TradingView
On H4, the price has escaped a Triangle and is heading for $8,400, where the execution of this pattern will finish. A strong signal confirming the decline of the asset will be a breakaway of the lower border of the ascending channel and securing below $7,000. In this case, the Bitcoin might stop growing and begin to fall with the aims at $6,385 and $5,500. The negative scenario will be canceled if the price breaks away $8,500, which will mean securing above a strong resistance level. In this case, the next aim of the growth will be at $9,000 and $9,500.
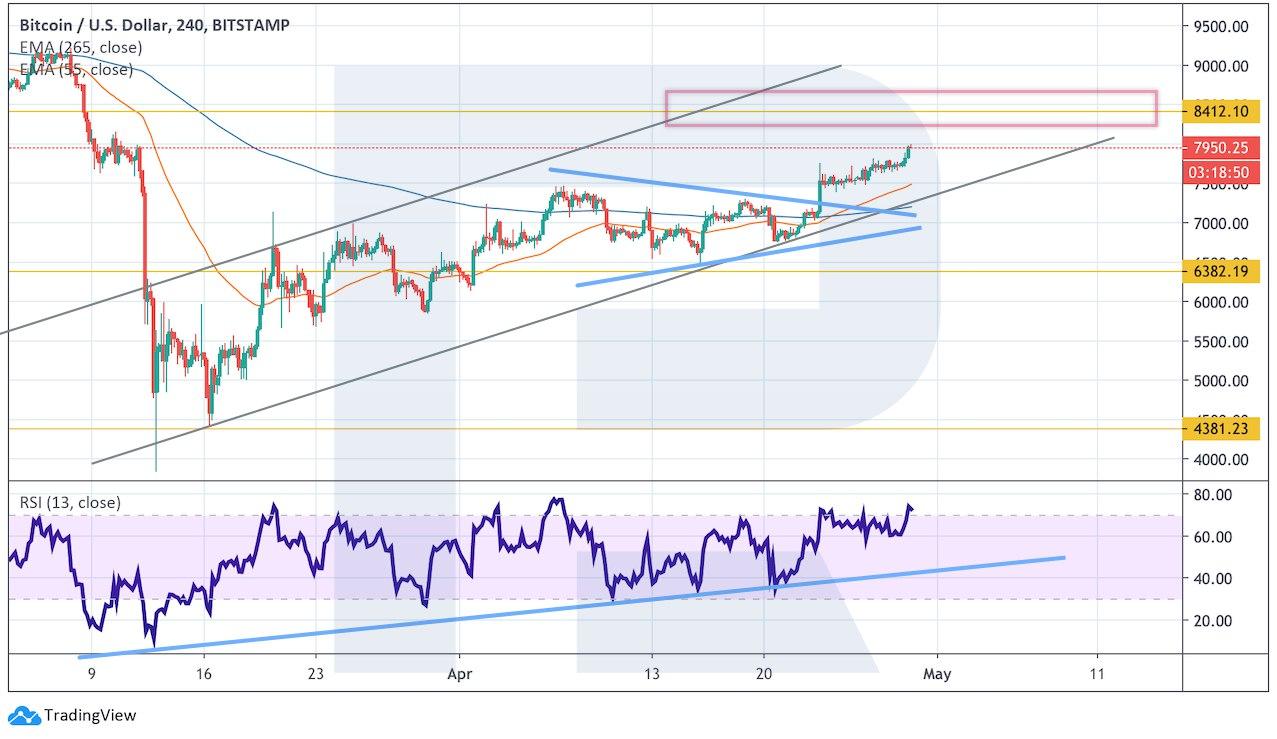
Photo: Roboforex / TradingView
Ethereum
On D1, the price of the asset keeps moving along the upper border of the Bollinger Bands indicator, indicating a strong bullish impulse. The aim of the growth may be the area near $250, where the upper border of the descending channel goes. Further growth will be confirmed by a bounce off the support line on the RSI. The scenario may no longer be valid if the price drops and breaks away the lower border of the ascending channel, securing under $150, in which case the falling will continue and the price may test $120.
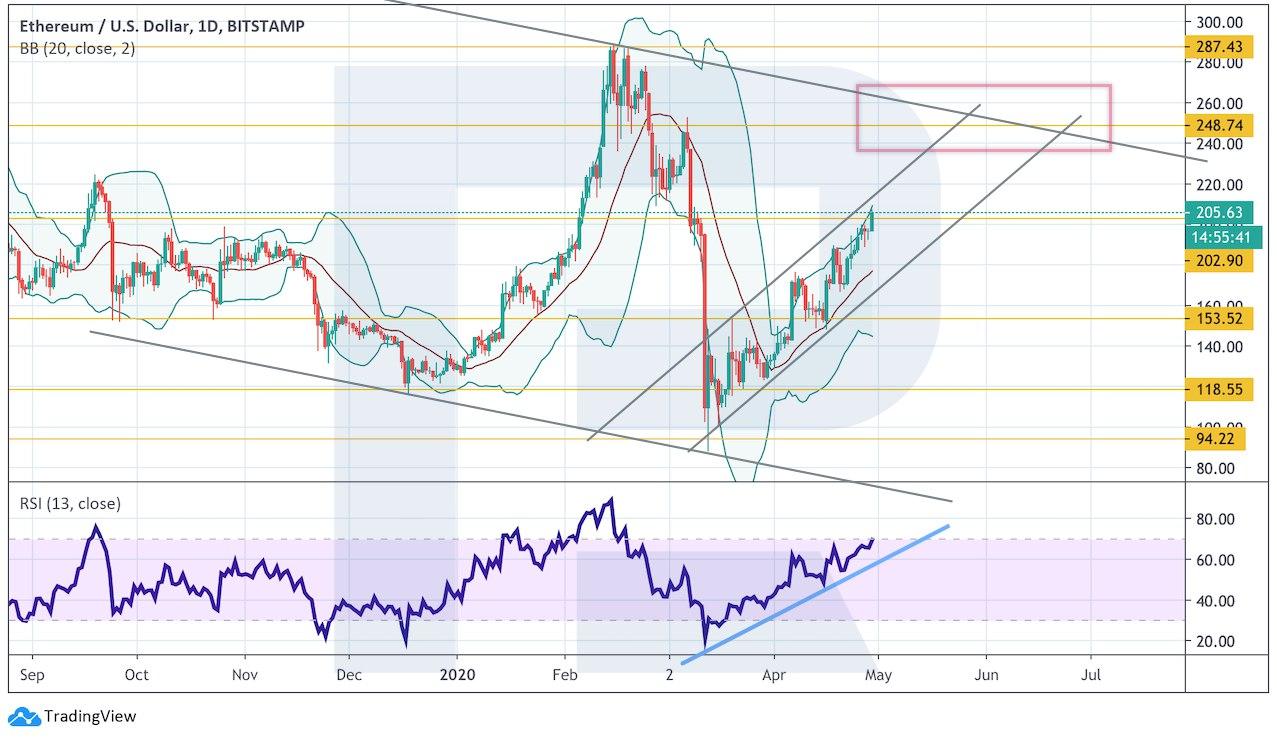
Photo: Roboforex / TradingView
On smaller timeframes, the price is growing inside an ascending channel. The quotations have broken away the upper border of the Bollinger Bands indicator; the price has not yet fallen below the lower border of the indicator, which means a strong bullish impulse. Such a movement may be reversed only by a breakaway of the lower border of the ascending channel and securing of the quotations under $170. Now we must expect a test of the nearest support area at $202 and further growth with the first aim at $225. Yet another signal confirming the growth will be a bounce off the support line on the RSI.
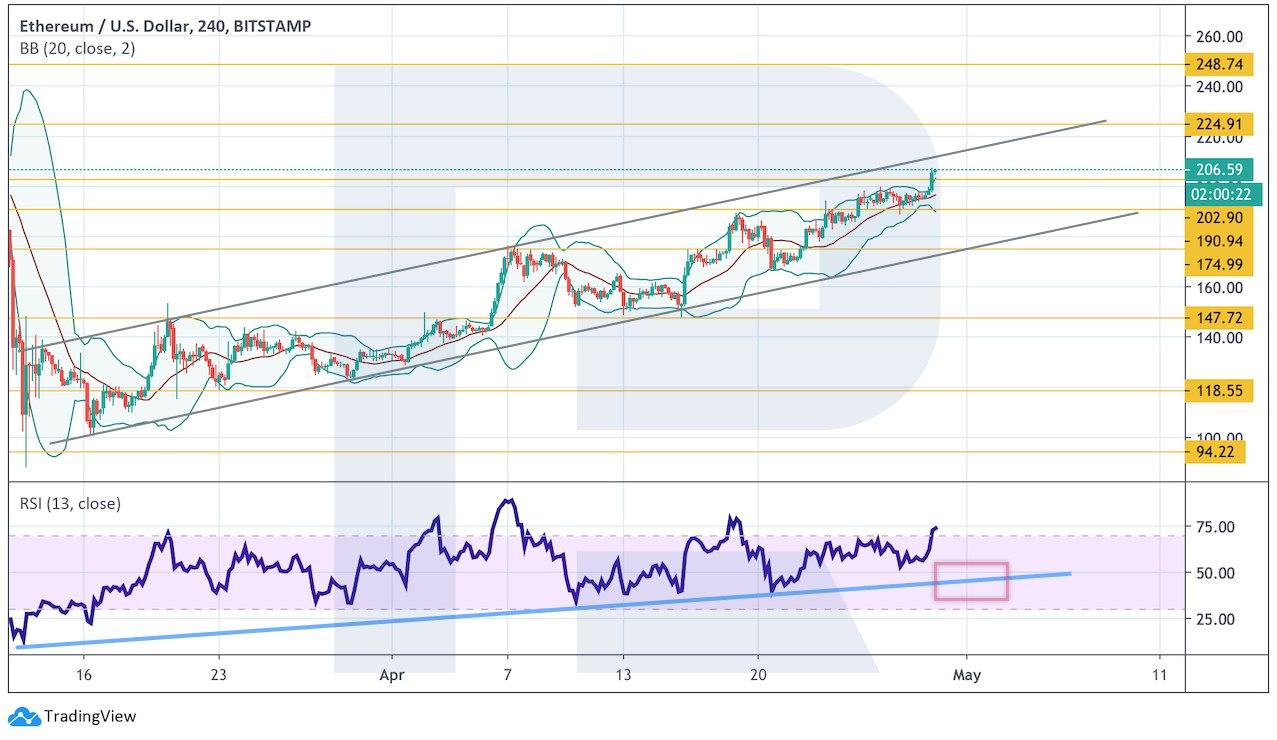
Photo: Roboforex / TradingView
Litecoin
LTC/USD is testing the resistance area; also, the buyers have managed to return into the Ichimoku Cloud. For a full-scale growth, we need to see a breakaway of the upper border of the Cloud and securing above $56, in which the growth might continue to $65. This scenario will be confirmed by another bounce off the support line on the RSI. The scenario may no longer be valid if the price falls below $36, which will mean a breakaway of the lower border of the Cloud and the return of the bearish momentum.
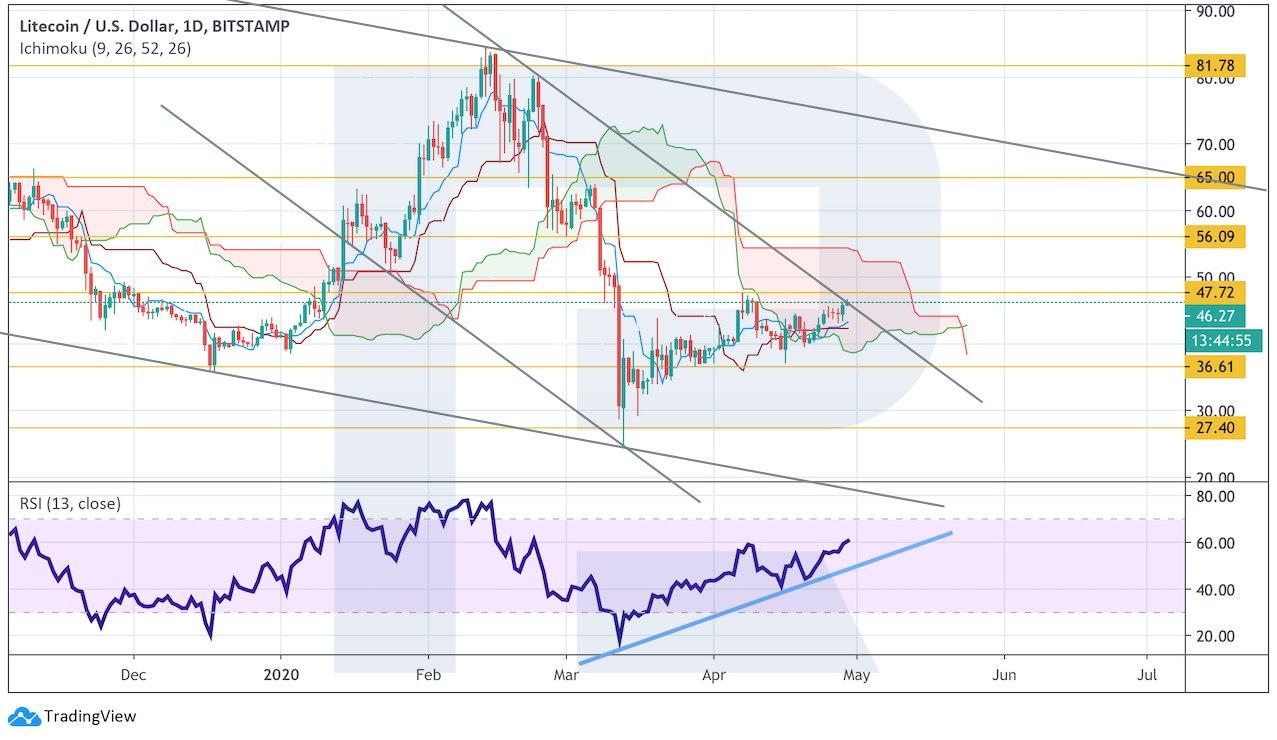
Photo: Roboforex / TradingView
On H4, the price is growing inside the channel borders. Earlier, there was a potential for a Head and Shoulders to form, however, the quotations have almost risen above the high, which suggests canceling of the model and further growth of the asset price. The nearest aim of the growth is $56. This scenario may be canceled by a decline below the level of $42, in which the sellers will return to the market, and the decline will go on.
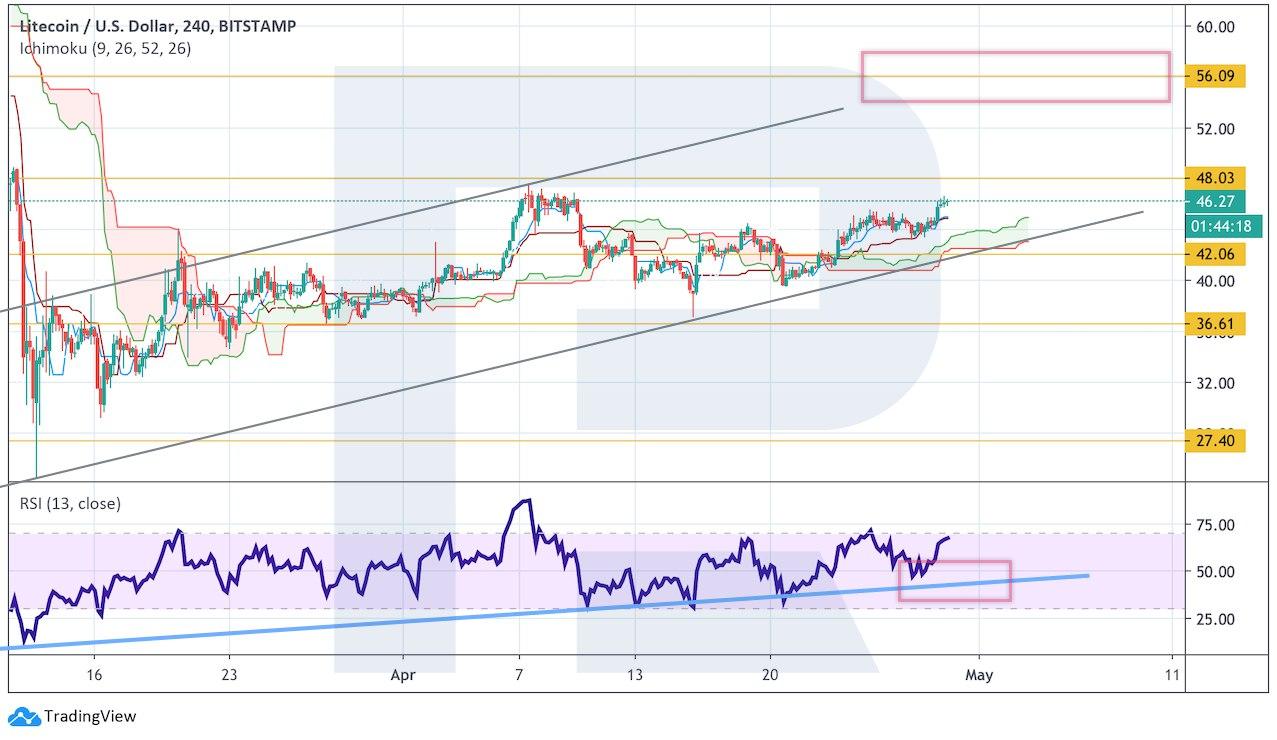
Photo: Roboforex / TradingView
EOS
The quotations have left the borders of the descending channel. The growth may continue to $4.20. The main scenario will be a test of the broken border near $2.75 and further growth. A strong signal confirming it will be a test of the support line on the RSI. The scenario may no longer be valid if the price falls below $2.25, which will mean the return of the price into the channel and further decline of the asset with the aim at $1.60.
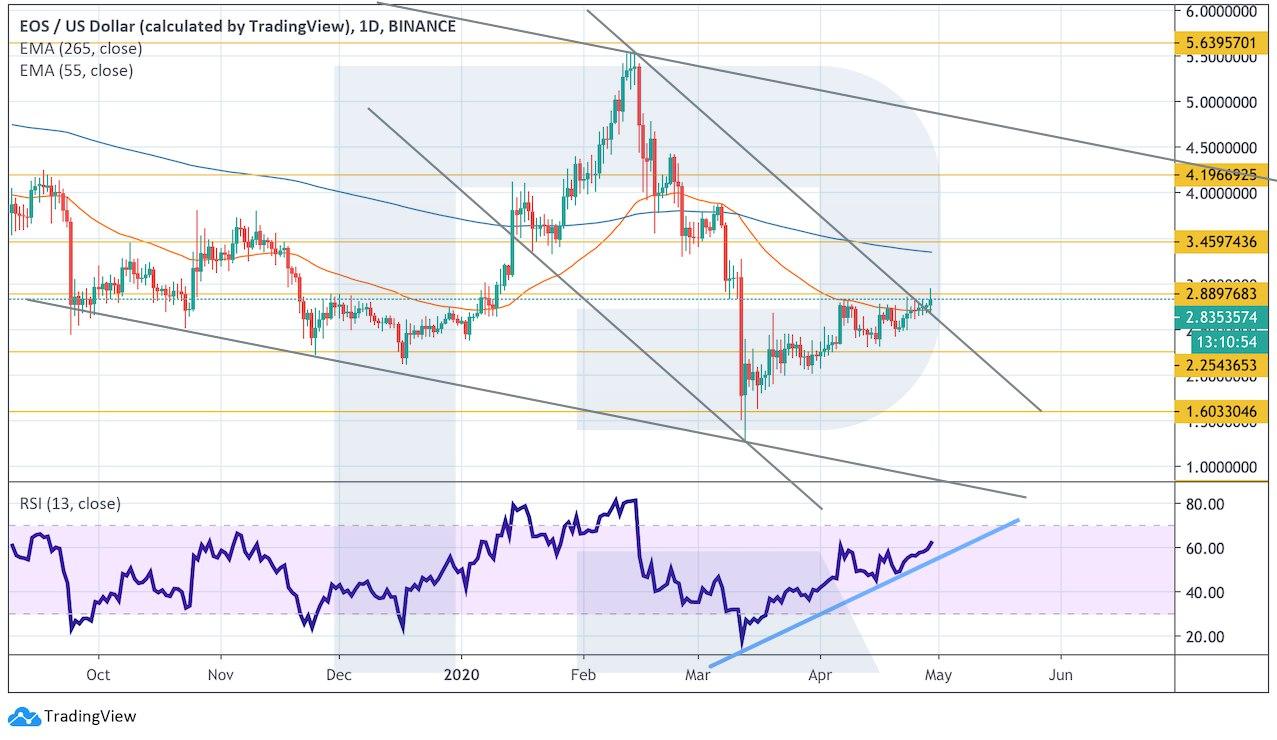
Photo: Roboforex / TradingView
On smaller timeframes, the price has broken out the upper border of a Triangle. We should expect further growth to $3.45 as the execution of this pattern. Another signal confirming this scenario will be a bounce off the support line on the RSI. The scenario may be canceled by a decline and a breakaway of $2.50, which will be a breakaway of the lower border of the ascending channel and further decline to $1.60.
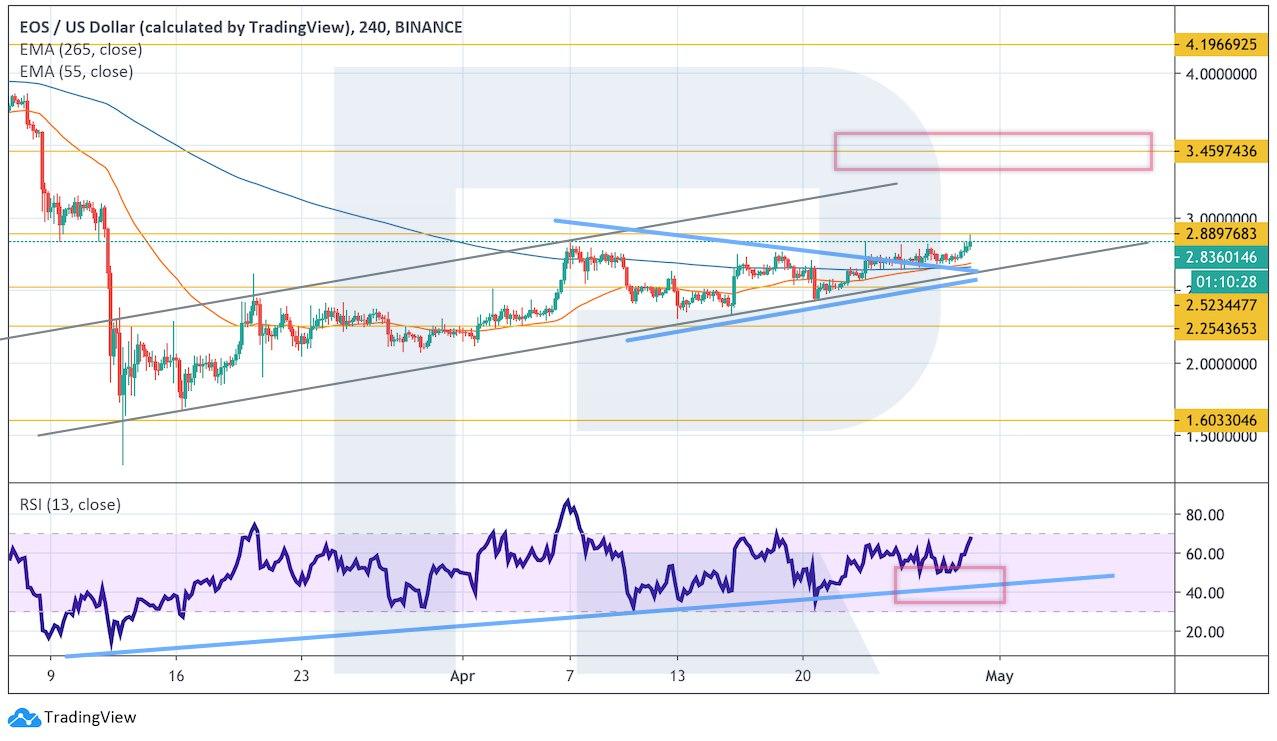
Photo: Roboforex / TradingView
Bitcoin Cash
On D1, the price is trying to break away the upper border of Bollinger Bands, as well as the upper border of the descending channel. As soon as the quotations manage to secure above $285, the growth will continue to $365 and above. This scenario will be confirmed by a bounce off the support line on the RSI. It may no longer be valid if the price drops and secures under $200, which will mean resuming the downtrend and further decline to $135.
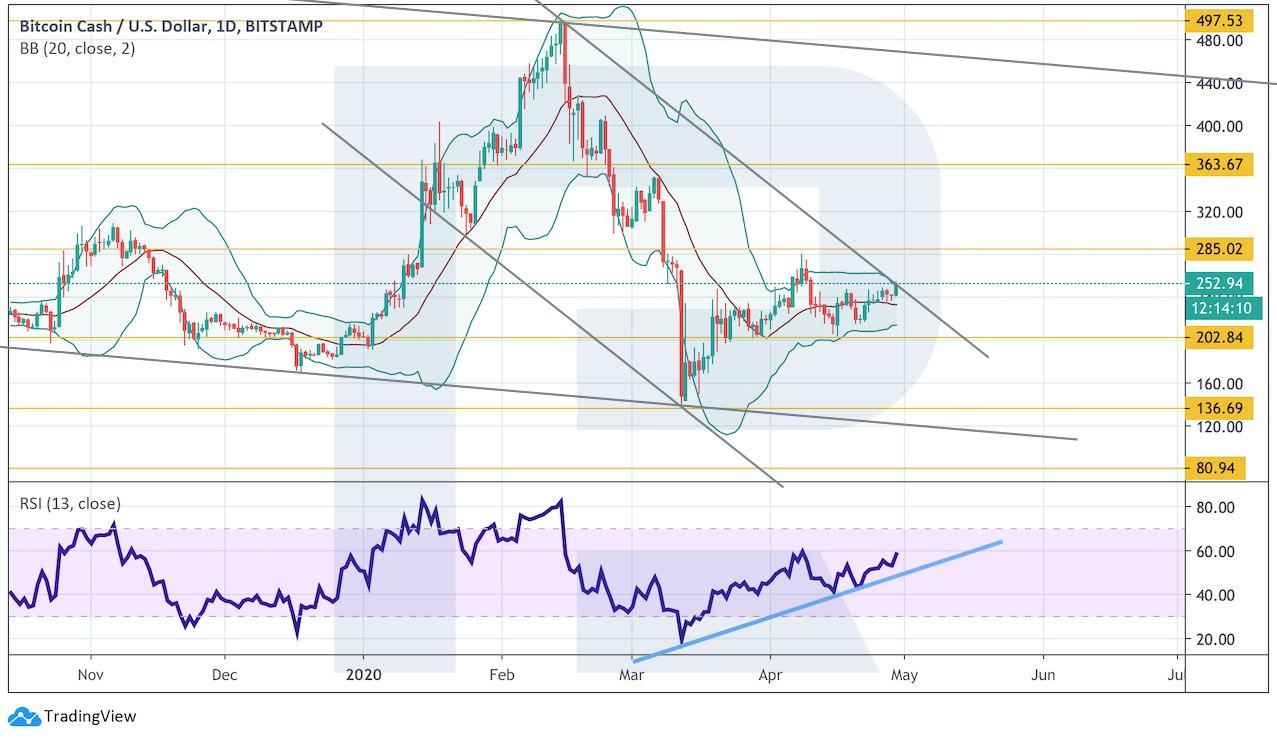
Photo: Roboforex / TradingView
On H4, the cryptocurrency keeps forming a reversal Head and Shoulders pattern. However, the RSI values have already broken away the descending trendline, which makes the breakaway of the local high by the price quite possible. In this case, we should not expect the pattern to execute downwards, and the aim of the growth will be the area near $365. The scenario may be canceled by a decline of the quotations and a breakaway of the lower border of the ascending channel, followed by securing under $225, which will mean the bearish momentum is back.
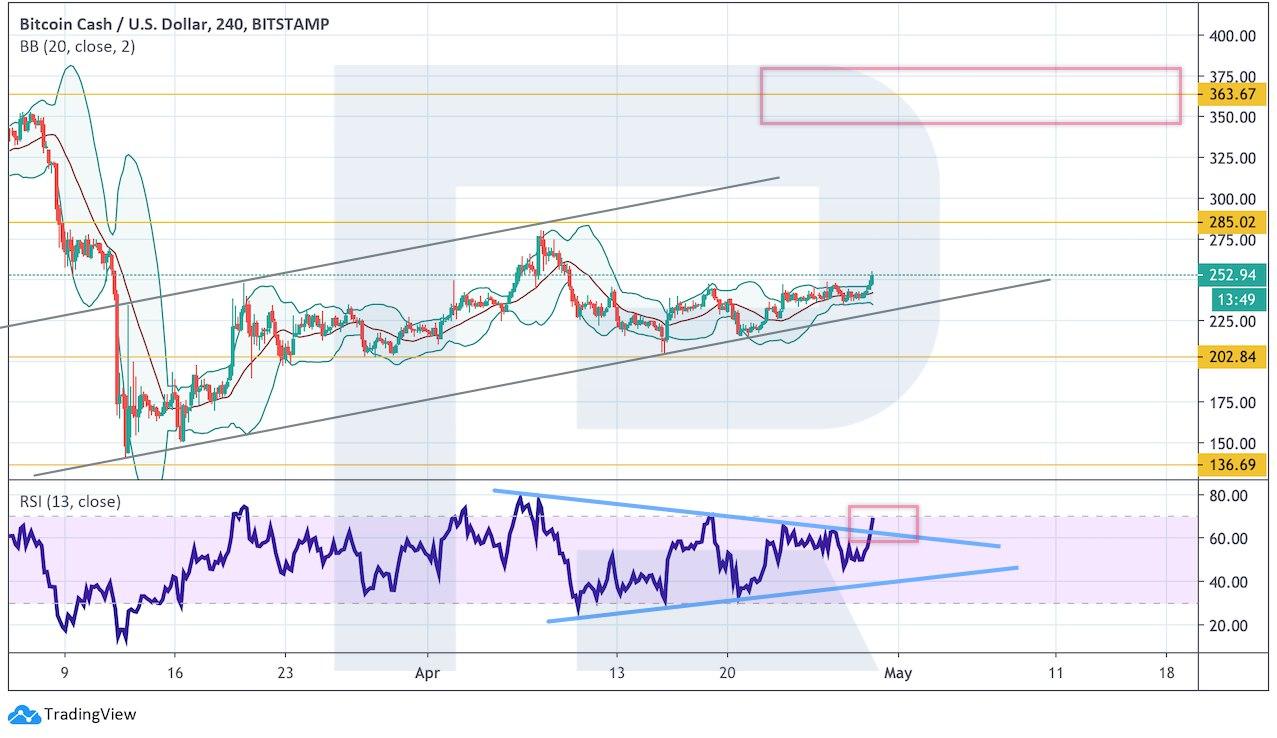
Photo: Roboforex / TradingView
Disclaimer: Coinspeaker is committed to providing unbiased and transparent reporting. This article aims to deliver accurate and timely information but should not be taken as financial or investment advice. Since market conditions can change rapidly, we encourage you to verify information on your own and consult with a professional before making any decisions based on this content.

Dmitriy Gurkovskiy is a senior analyst at RoboForex, an award-winning European online foreign exchange forex broker.