Dmitriy Gurkovskiy, a senior analyst at foreign exchange broker RoboForex, provides his vision of the possible tendencies in price changes for Bitcoin as well as for other major cryptos.
Bitcoin is still moving below an important area and only a breakout of $10,400 may indicate a new bullish rally. Ethereum is looking pretty strong. Here, the pair is once again moving to test the resistance area despite bears’ attempts to fix below $218 and complete a Double Top reversal pattern. If the bullish pressure continues and they break $255, it may indicate that the sideways movement is over and the asset may resume growing towards new highs. Both Litecoin and Bitcoin Cash continue moving within their respective long-term sideways channel, which neither bulls nor bears were able to break. Still, it’s very essential to remember that if such channels are finally broken, possible targets may be at the distance equal to these channel’s width. That’s why, after the assets break their channels, they may start strong movements in the direction of a breakout.
Bitcoin
In the daily chart, Bitcoin is testing the downside border of a Triangle pattern. There is a potential for a further decline towards $7,425 while completing the pattern. Another signal in favor of this idea will be a rebound from the resistance lien at the RSI: right now, the indicator is testing this line. To confirm this scenario, the price must break the support area and fix below $8,695. However, this scenario may no longer be valid if the asset breaks $10,085. In this case, the Triangle pattern will be canceled and the instrument may continue trading upwards to reach $10,635. This movement may start a string ascending tendency.
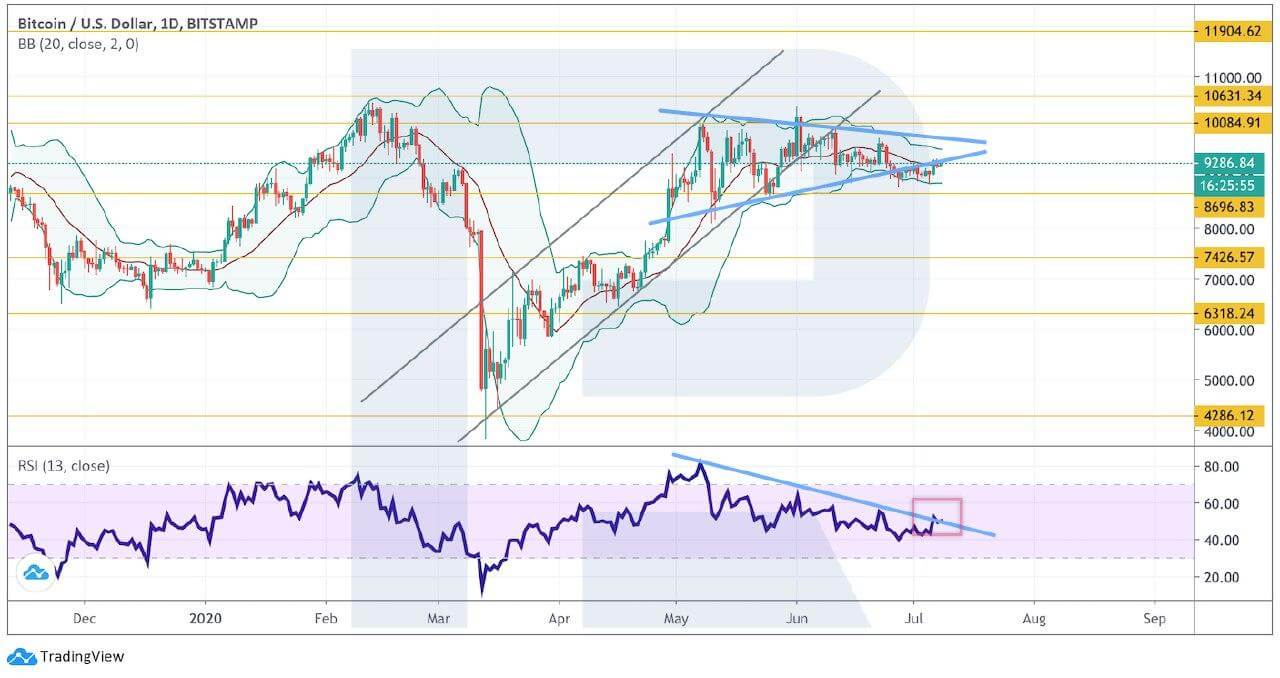
Photo: RoboForex / TradingView
As we can see in the H4 chart, BTC/USD is correcting within the channel; here, the cryptocurrency has been moving sideways since the end of June. Usually, if the market breaks such a channel, it moves in the direction of a breakout and covers the distance equal to the width of this movement. The closest resistance is at $9,510. The cryptocurrency is expected to test the descending channel’s upside border and then resume falling with the first target at $8,835. A strong signal in favor of this scenario will be a rebound from the resistance line at the RSI. To confirm this scenario, the instrument must break the support area and fix below $8,835. In this case, the next downside target may be at $8,250.
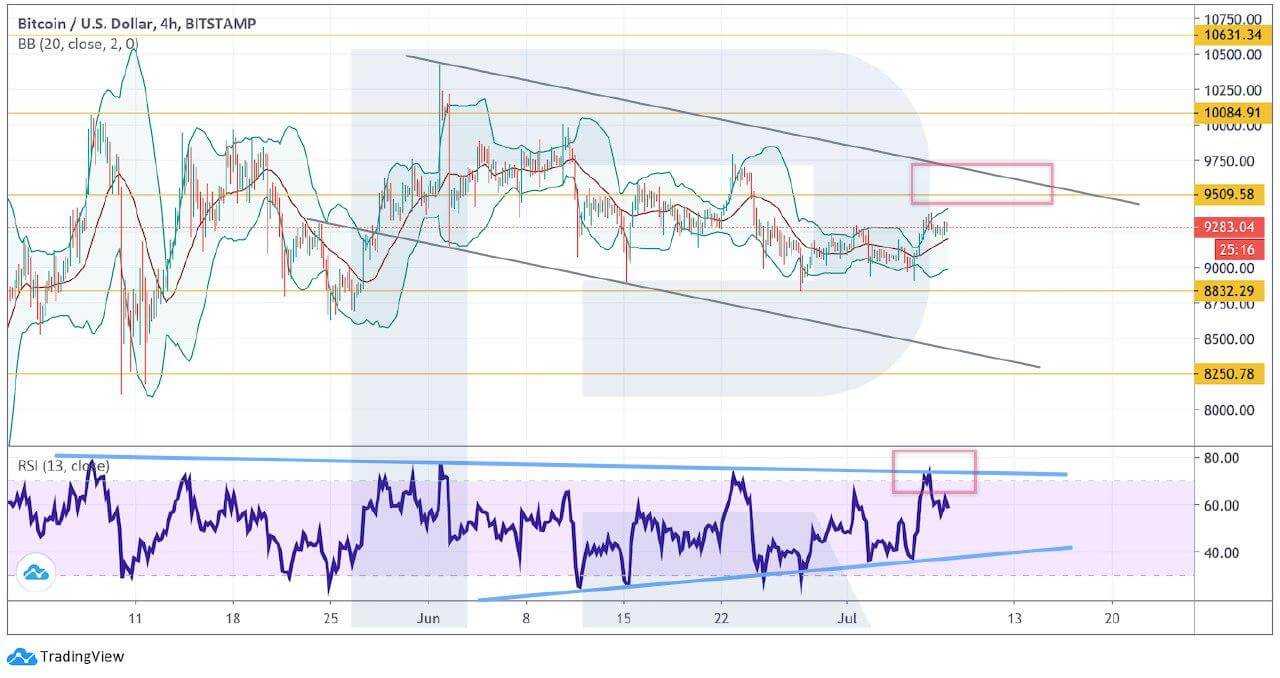
Photo: RoboForex / TradingView
Ethereum
ETH/USD is back to testing the descending channel’s upside border, which may indicate a significant bullish pressure. However, as long as the asset is moving below $255, the “growth” scenario won’t be effective. Right after the pair breaks the descending channel, bulls may start a new ascending tendency. The key trading idea implies a rebound from the resistance line at the RSI, which will be a strong signal in favor of a rebound on the price chart and a further decline towards the support area at $218. After breaking it, the instrument may continue falling to reach the next one at $177.
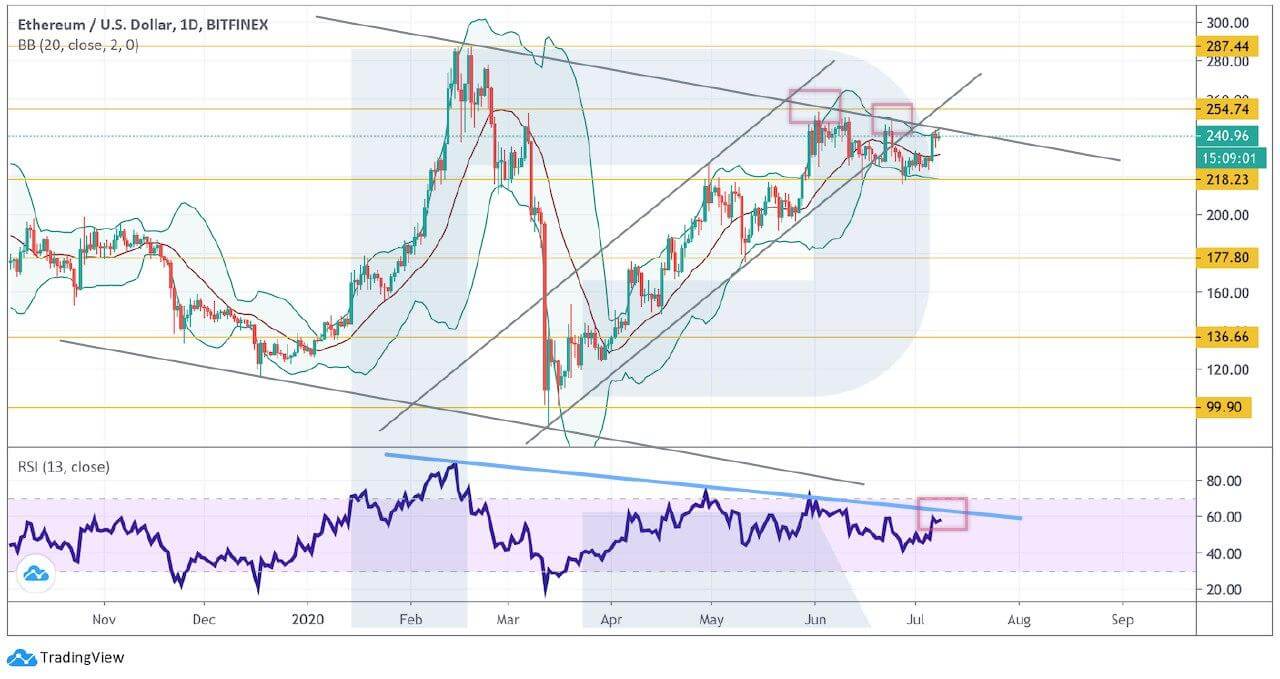
Photo: RoboForex / TradingView
On shorter timeframes, the price is also moving upwards and may test the descending channel’s upside border in the nearest future. We should also note that bears have failed to break the support area and fix below $218. If it happens, the price may leave the rising channel and start a proper decline towards $196 or even deeper. A signal in favor of this scenario is a rebound from the resistance line at the RSI. As we can see, in the past the price did move downwards when the indicator was testing the line.
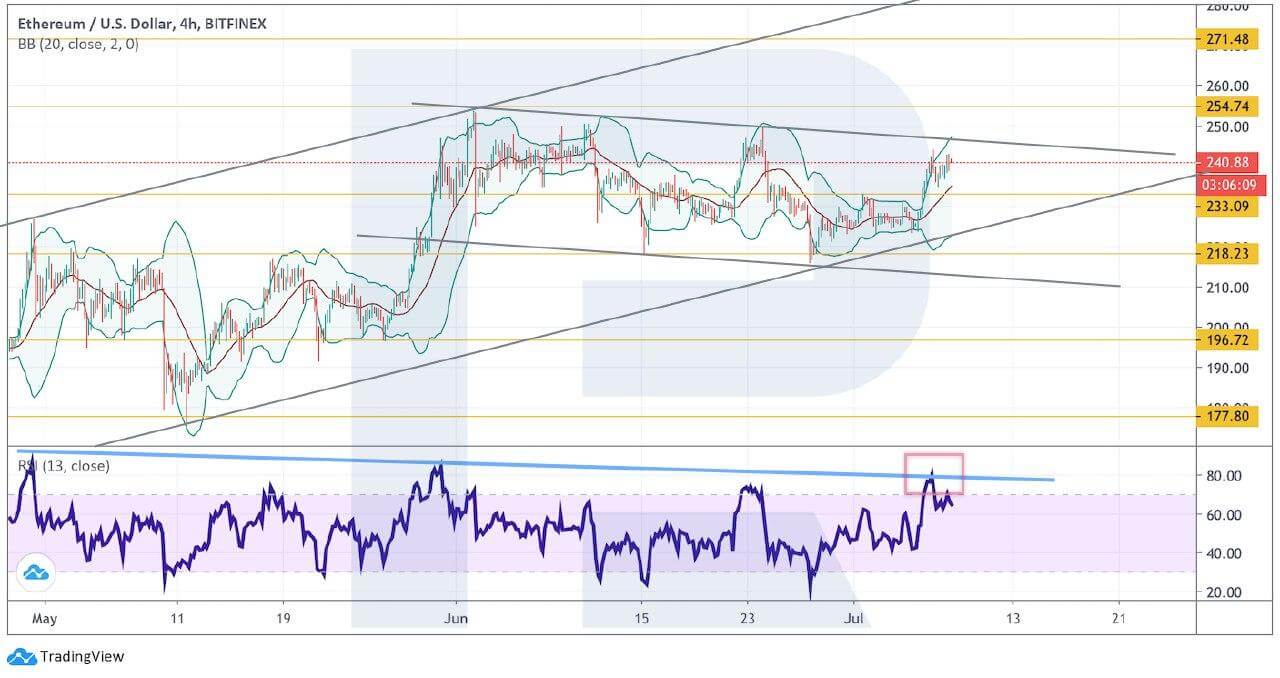
Photo: RoboForex / TradingView
Litecoin
Litecoin is back inside a Triangle pattern, thus indicating a serious bullish pressure. Moreover, bears have failed to break the support area and fix below $38. However, at the moment, the RSI indicator is testing the resistance line and a successful rebound from the line may cause another descending wave on the price chart. Still, the bearish scenario may no longer be valid if the asset breaks the resistance area and fixes above $51. After that, the instrument may continue trading upwards with the target at $68.
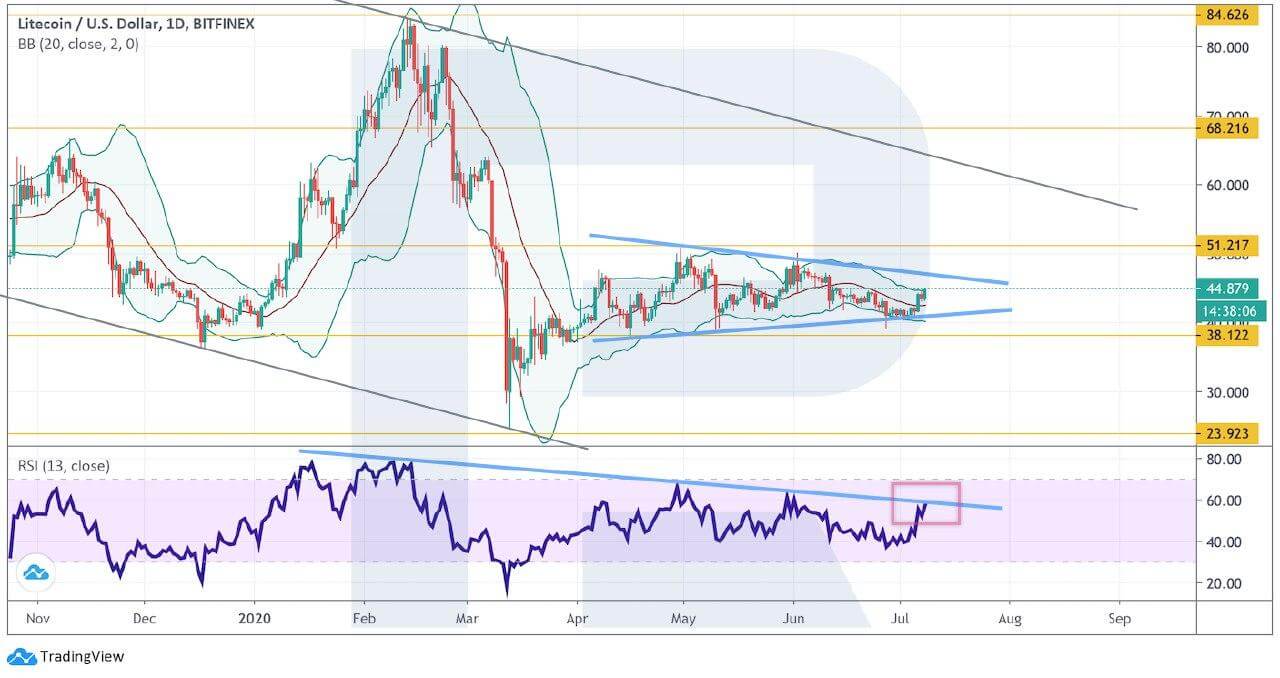
Photo: RoboForex / TradingView
As we can see in the H4 chart, LTC/USD is rising while forming a “5-0” bearish pattern. Later, the pair is expected to continue growing and test the pattern’s upside border at $46.80. after this movement is complete, the cryptoasset may resume falling with the target at $38. A strong signal in favor of a further decline will be another rebound from the resistance line at the RSI. However, the bearish scenario may be canceled if the market breaks the descending channel’s upside border and fixes above $48. In this case, the instrument may continue trading upwards to reach $51 or even break it.
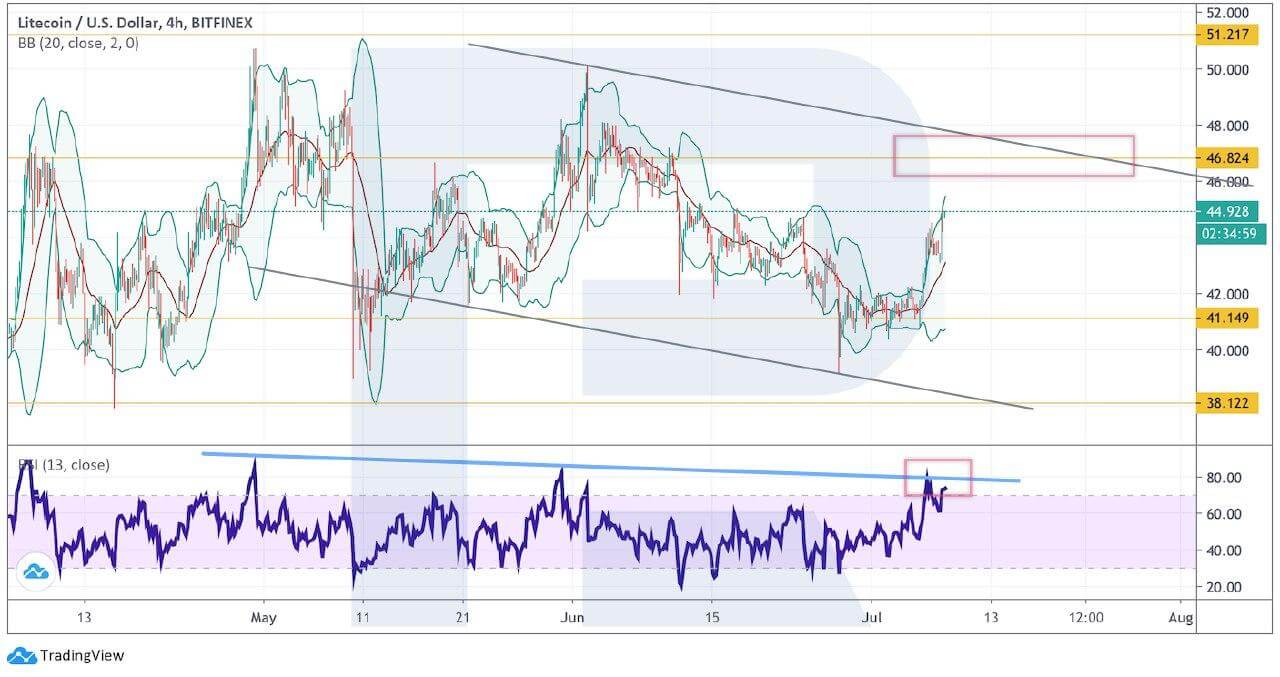
Photo: RoboForex / TradingView
Bitcoin Cash
As we can see in the daily chart, the situation is quite similar to Litecoin: the asset has failed to break the support area and stop its long-running sideways channel. However, the RSI indicator is currently testing the resistance line, that’s why one shouldn’t exclude a new decline right from the current levels. Still, this bearish scenario may no longer be valid if the pair continues growing to break the resistance area and fix above $280. After that, the instrument may continue trading upwards to reach $356.
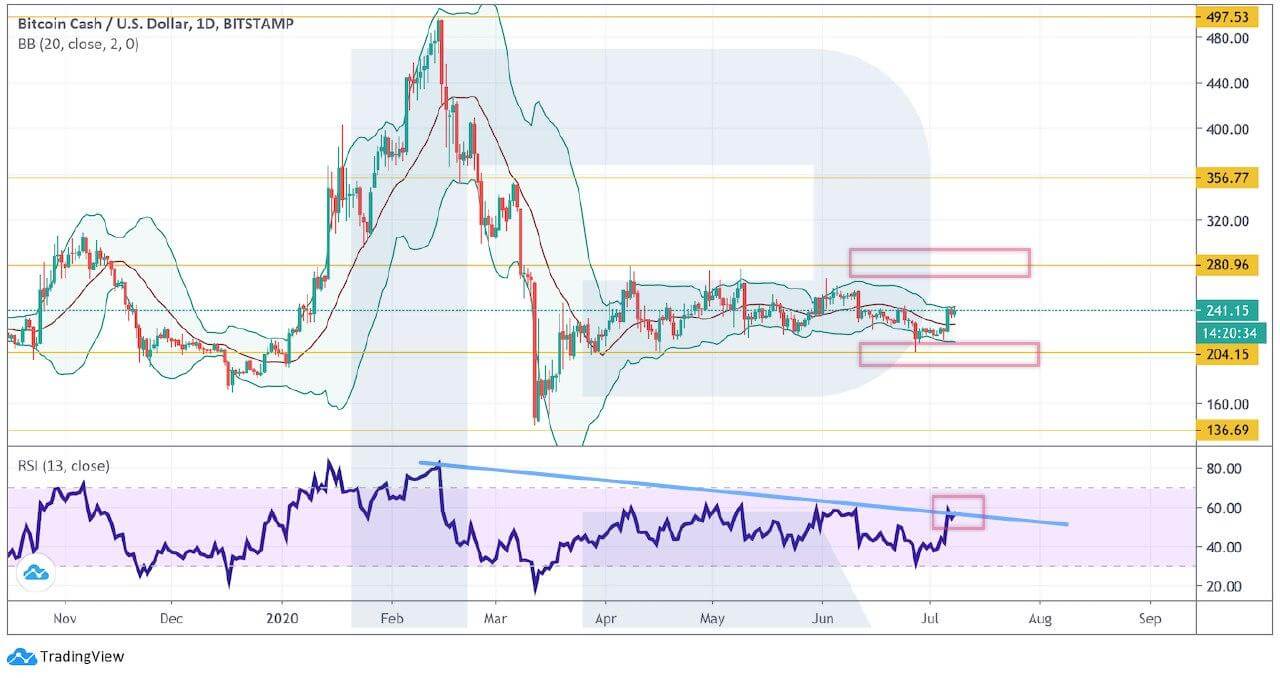
Photo: RoboForex / TradingView
In the H4 chart, Bitcoin Cash is growing towards the descending channel’s upside border. One should expect the price to test $250, rebound from it, and then start a new decline towards $204. Another signal in favor of this idea will be a rebound from the resistance line at the RSI. However, this scenario may be canceled if the market breaks the descending channel’s upside border and fixes above $260. In this case, the asset may continue trading upwards to reach $280 or even break it.
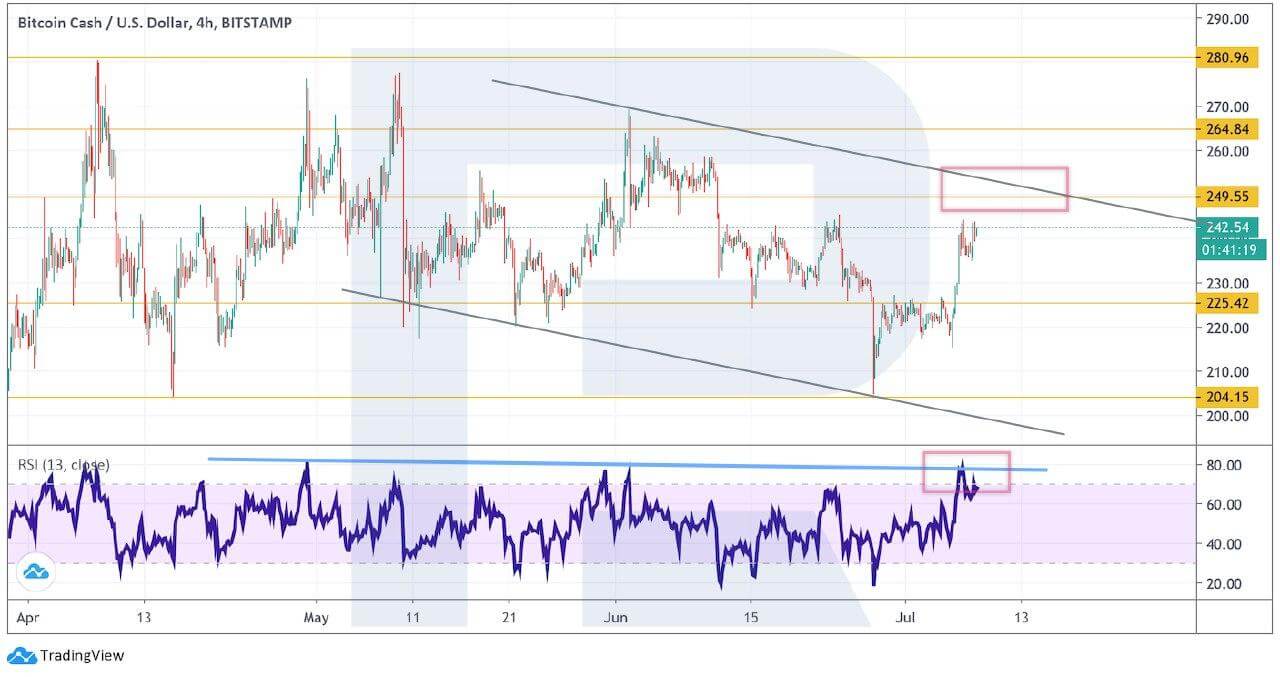
Photo: RoboForex / TradingView
XRP
In the daily chart, XRP is recovering rather aggressively. The RSI indicator hasn’t reached the resistance line yet but may rebound from it in the future, thus forcing a new decline of the price. One should expect the pair to continue the bullish correction and then test 0.2160. This test may result in a new descending movement. However, this scenario may no longer be valid if the instrument breaks $0.22. In this case, a Head & Shoulders reversal pattern, which is still effective right now, may be canceled and the asset may continue trading upwards.
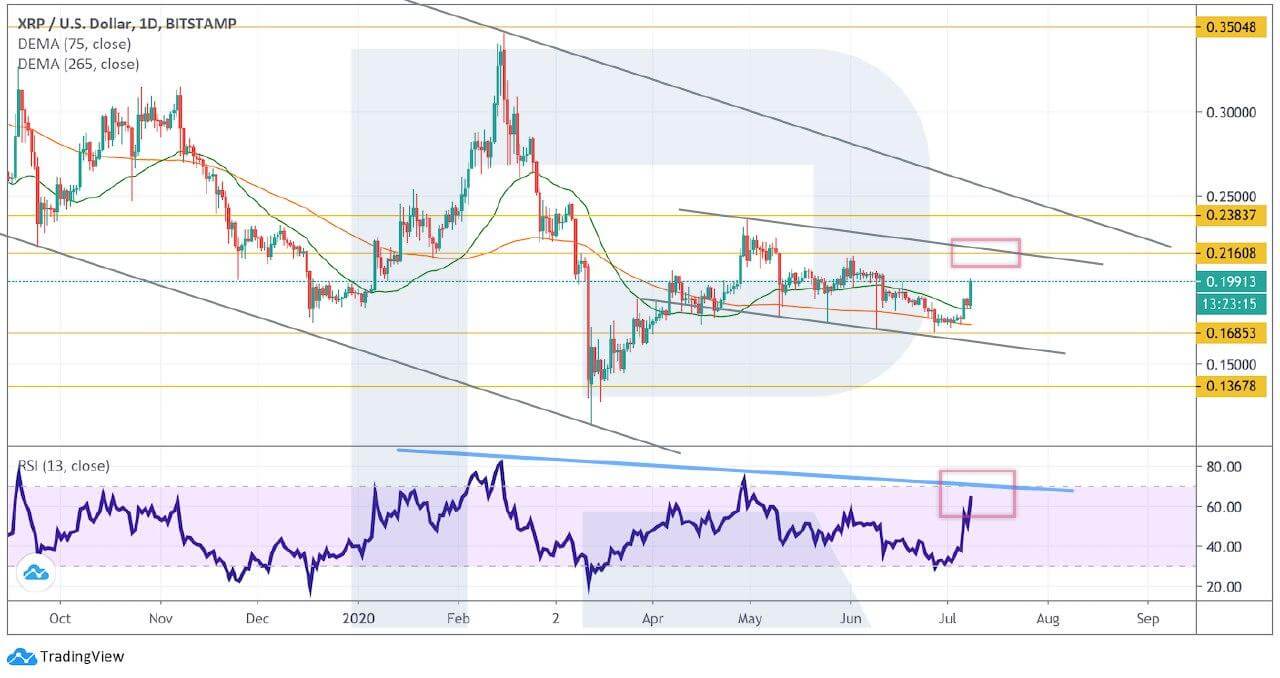
Photo: RoboForex / TradingView
Shorter timeframes show a strong bullish impulse, that’s why a signal to sell may be a breakout of the ascending trendline at the RSI. In this case, the price may also break the rising channel’s downside border. The closest downside target may be at $0.1685. However, this scenario may be canceled if the instrument breaks $0.2050. After that, the asset may leave the descending channel and continue trading upwards to reach $0.2160 or even higher.
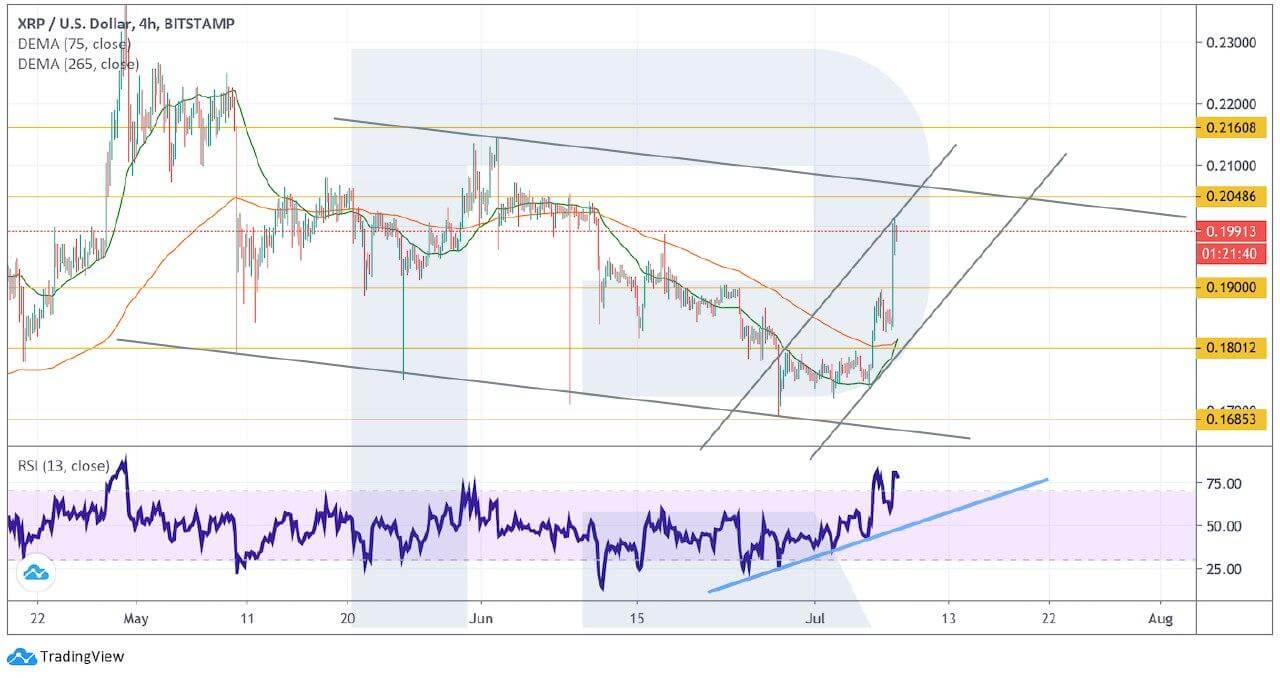
Photo: RoboForex / TradingView
Disclaimer: Coinspeaker is committed to providing unbiased and transparent reporting. This article aims to deliver accurate and timely information but should not be taken as financial or investment advice. Since market conditions can change rapidly, we encourage you to verify information on your own and consult with a professional before making any decisions based on this content.

Dmitriy Gurkovskiy is a senior analyst at RoboForex, an award-winning European online foreign exchange forex broker.