
Dmitriy Gurkovskiy, a senior analyst at foreign exchange broker RoboForex, provides his vision of the possible tendencies in price changes for Bitcoin as well as for other major cryptos.
The cryptocurrency market is correcting before another descending wave. In the past, Bitcoin didn’t start rising aggressively after the halving, on the opposite, it was even falling for a while and managed to break its previous highs only 3-6 months later. Right now, an interesting scenario will be to see the major digital asset falling towards $6,000, where it is expected to complete a reversal pattern, which may push Bitcoin towards new highs in the mid-term. However, if bulls manage to break $10,500 from the current levels, the reversal pattern may be canceled but a new growth towards new highs may yet still happen.
Bitcoin
In the H4 chart of BTC/USD, there is a potential for the formation of an Inverted Head & Shoulders pattern. To complete the pattern, the asset must fall towards $6,200-5,800, where it may start new growth. A signal in favor of the above0-mentioned decline is a rebound from the resistance line at the RSI. However, the bearish scenario may no longer be valid if the price skyrockets and breaks $10,550. In this case, the reversal pattern will be canceled and the pair will continue growing to reach $13,865. But if the instrument falls towards $6,000 and fails to reverse, the asset may break $3,720 to cancel the pattern.
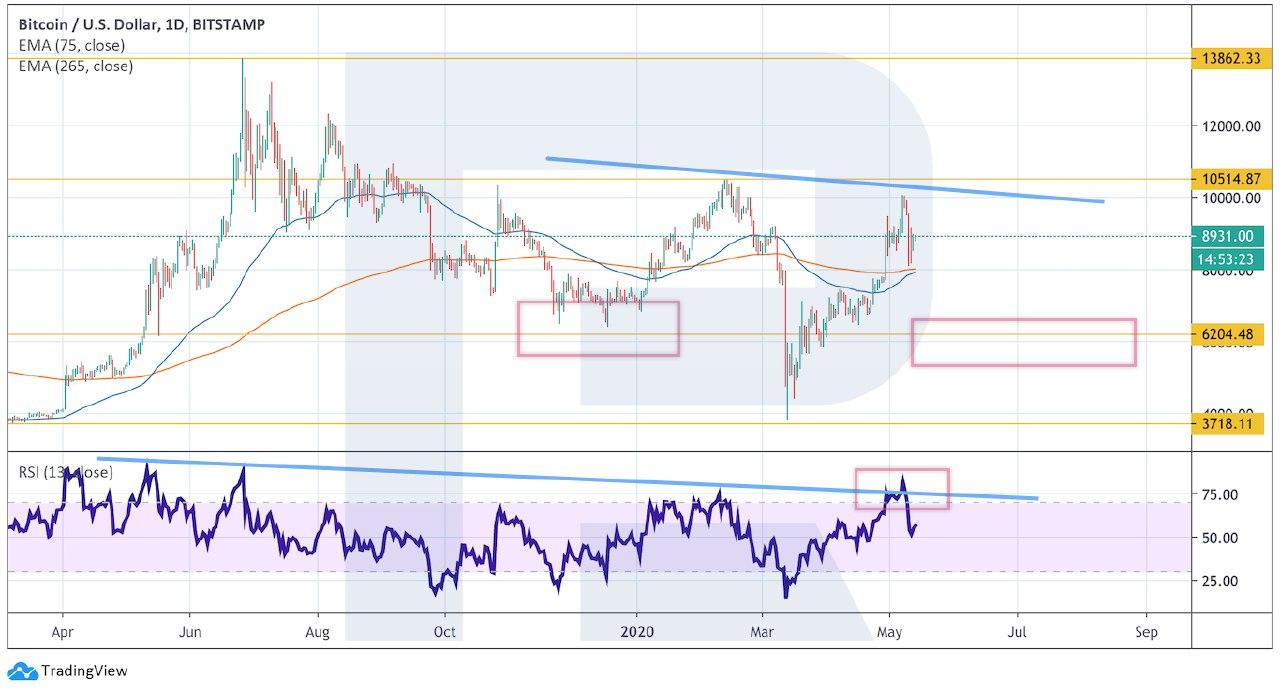
Photo: Roboforex / TradingView
As we can see in the H4 chart, Bitcoin is rebounding from the rising channel’s descending border. Still, it’s too early to discuss a new decline. However, the RSI has already broken the ascending trendline, thus indicating a possible decline in the nearest future. Right after the pair breaks $8,005, once can expect a descending movement towards $6,000 and switch to the scenario with a reversal pattern from the daily chart. Nevertheless, this scenario may be canceled if the price continues growing and fixes above $9,555. In this case, the upside target will be $10,515.
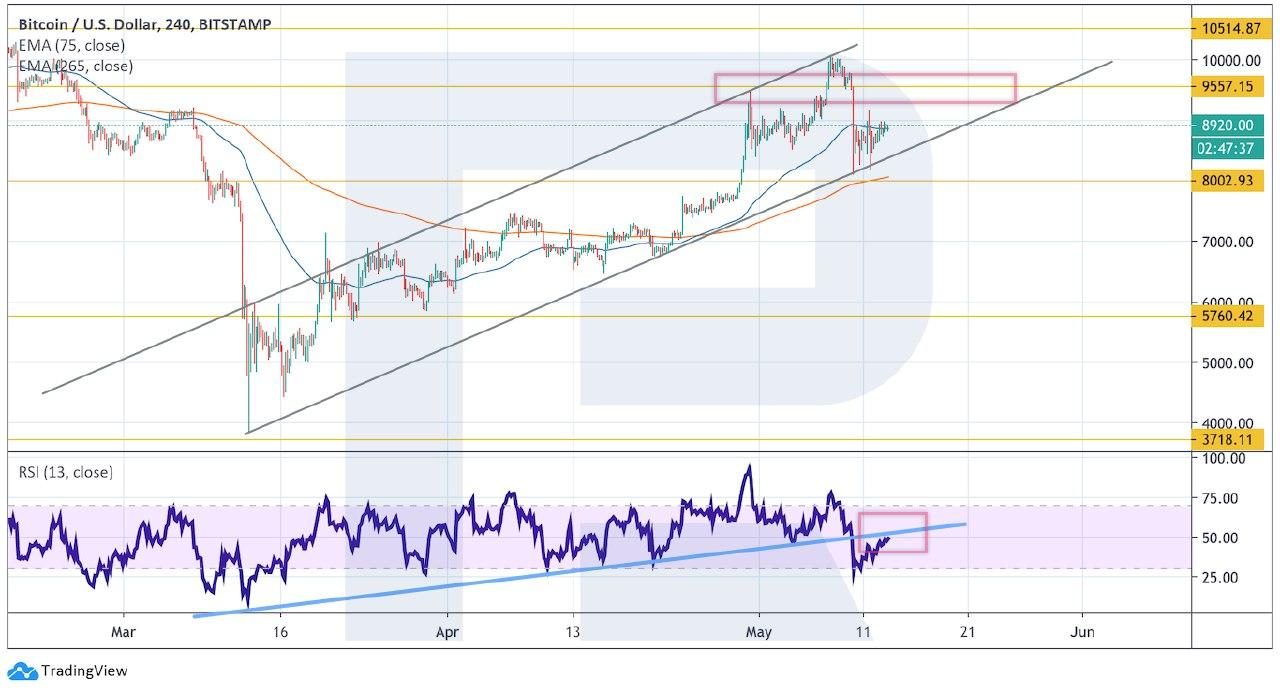
Photo: Roboforex / TradingView
Ethereum
As we can see in the daily chart, Ethereum has been able to break the middle band of the Bollinger Bands indicator, which indicates a bearish pressure and rebound from an important resistance level. In the future, the price is expected to fall with the first target at $153. A strong signal in favor of this idea is a breakout of the trendline at the RSI. However, the bearish scenario may no longer be valid if the pair breaks the resistance level and fixes above $230. In this case, the instrument may resume trading upwards with a potential target at $287.
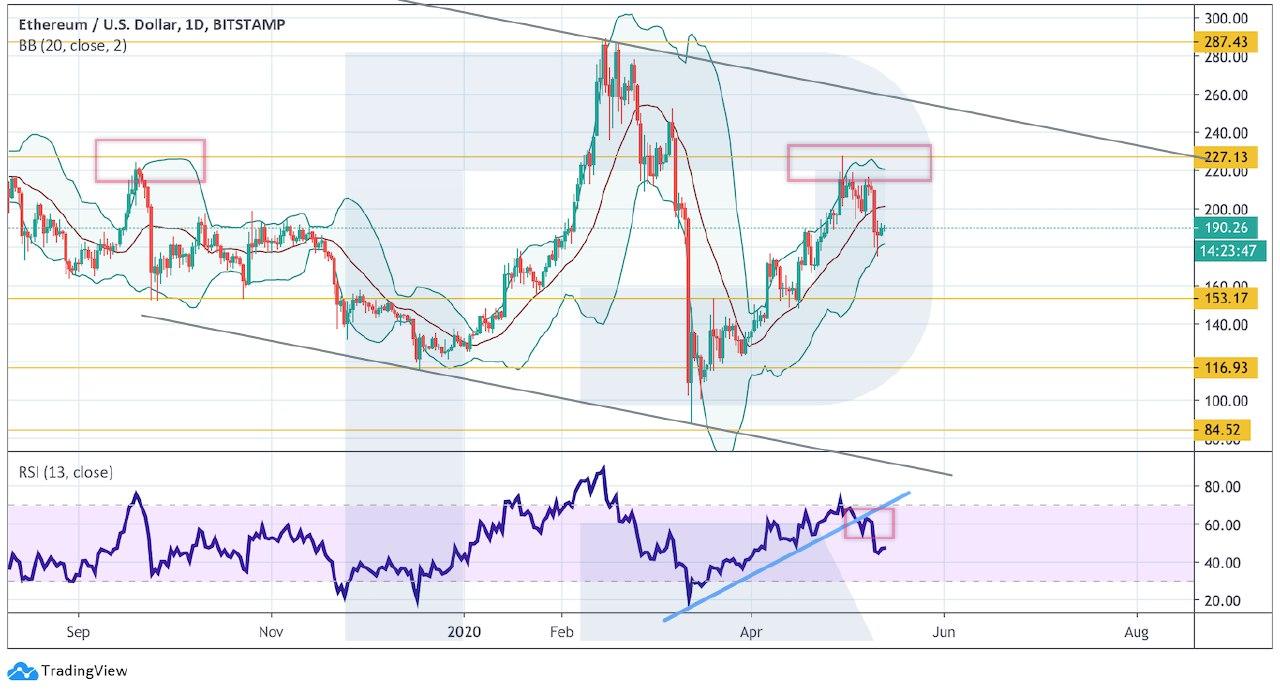
Photo: Roboforex / TradingView
On shorter timeframes, ETH/USD is no longer moving inside the rising channel. The key trading idea implies that the asset may test the channel’s downside border at $200 and then continue trading downwards with the target at $147. A strong signal in favor of this idea will be a rebound from the resistance level at the RSI. However, the bearish scenario may be canceled if the pair grows and breaks $220. In this case, the instrument may continue trading upwards to reach $250 or even higher.
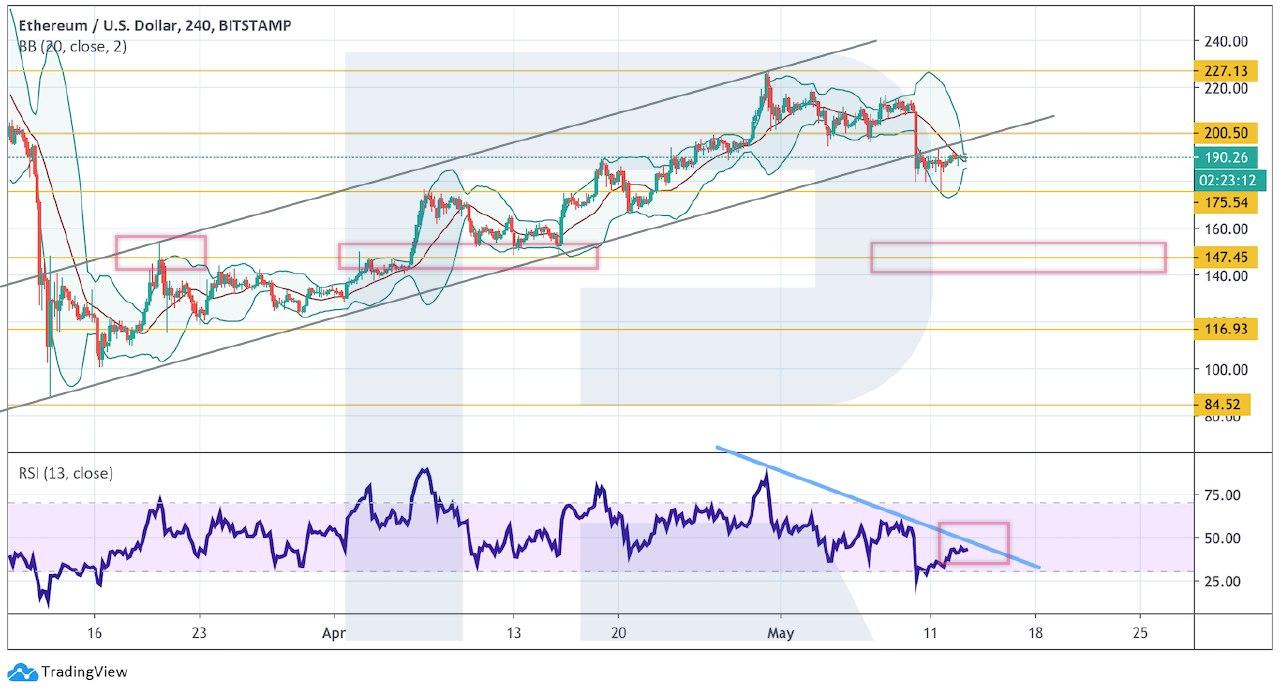
Photo: Roboforex / TradingView
Litecoin
As we can see in the daily chart, LTC/USD has failed to fix above $50. There are chances to see a further decline with a potential target at $27-16. Other signals in favor of this scenario are a breakout of the ascending trendline at the RSI and a breakout of the rising channel’s downside border. However, this scenario may be canceled if the pair grows and breaks $50. In this case, the asset will resume trading upwards to reach $65.
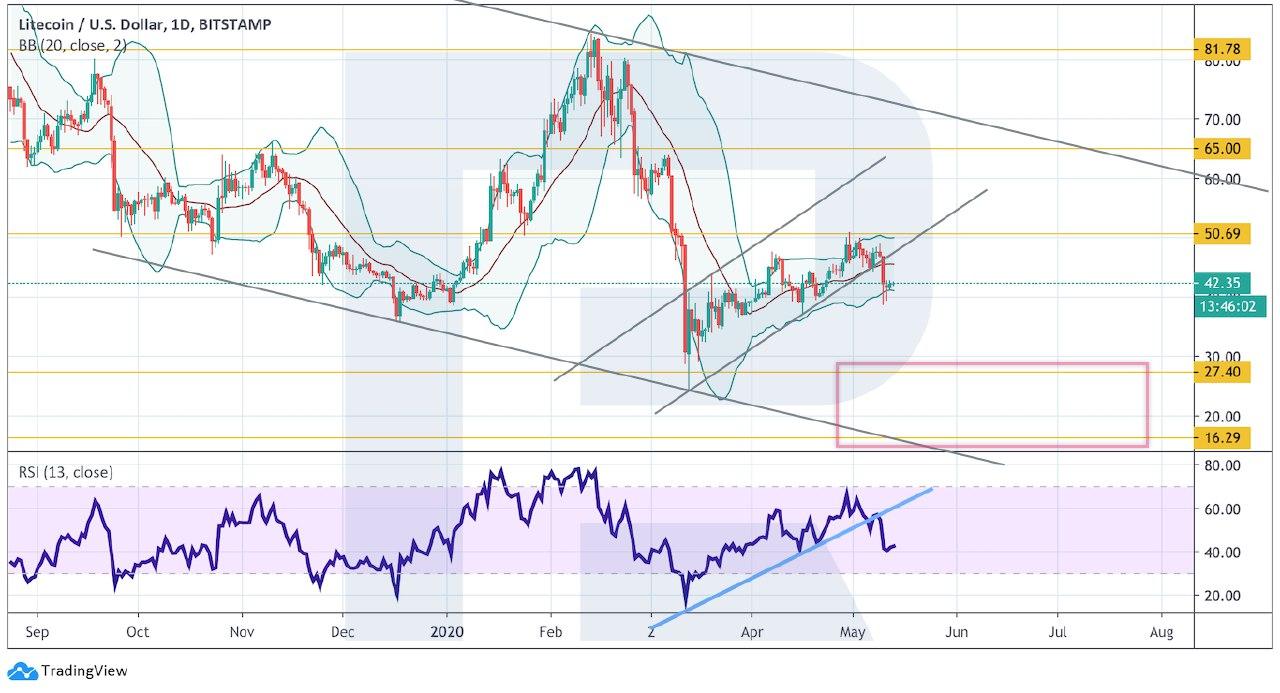
Photo: Roboforex / TradingView
In the H4 chart, there is a potential for the formation of an Inverted Head & Shoulders reversal pattern. Litecoin is expected to grow towards $47, where it may complete the pattern’s “right shoulder” and then start a new decline with the target at $38. A good signal in favor of this idea will be a test of the resistance line at the RSI. However, this scenario may be canceled if the instrument skyrockets to break the local high and fixes above $50. In this case, the pattern will be canceled and the asset will continue moving upwards.
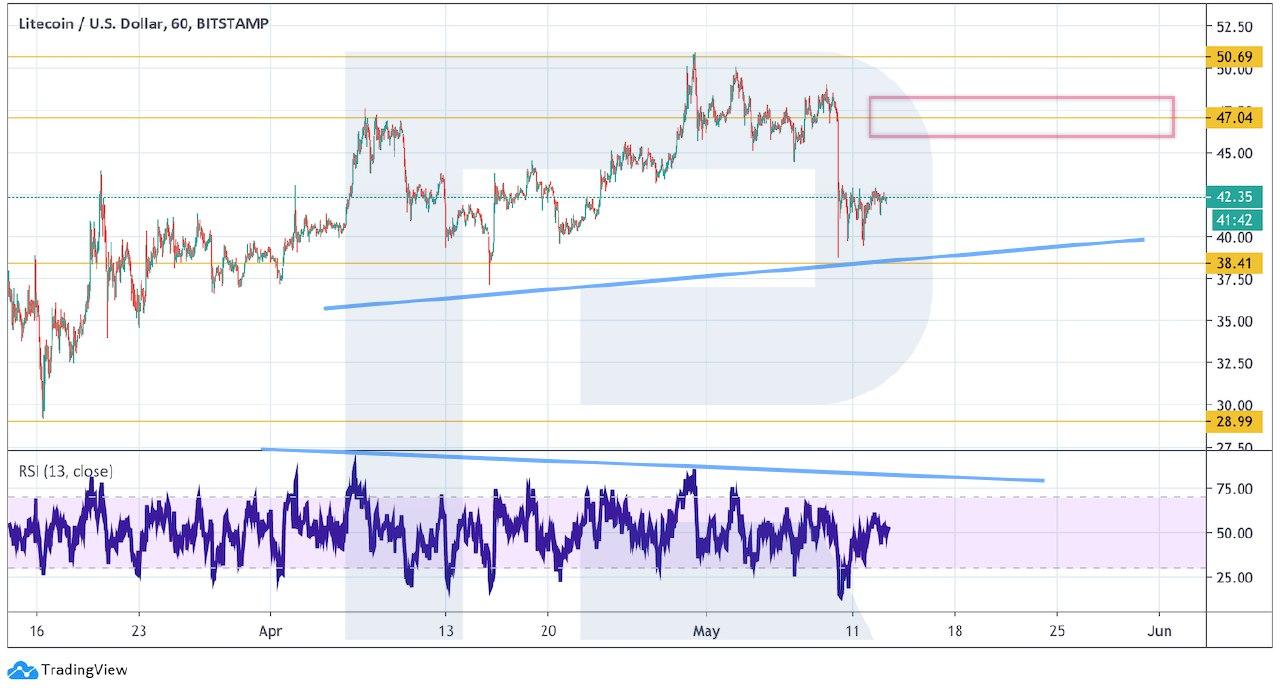
Photo: Roboforex / TradingView
EOS
In the daily chart, EOS has been able to break the downside border of the Ichimoku Kinko Hyo Cloud, thus indicating a resumption of the descending tendency. There is potential for further decline with the target at $1.28 after the price tests the broken border. Another signal in favor of the bearish scenario is a breakout of the ascending trendline at the RSI. However, this scenario may no longer be valid if the pair breaks the Cloud’s upside border and fixes above $3.36. in this case, the instrument may continue growing with a potential target at $5.56.
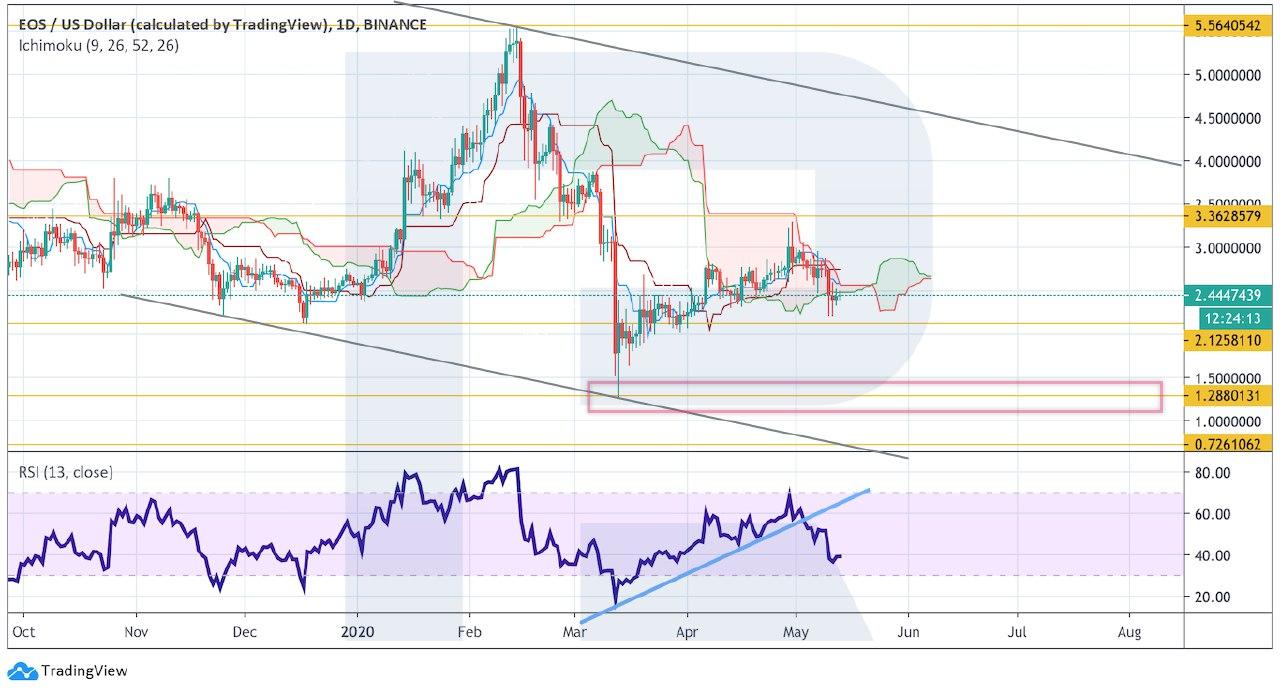
Photo: Roboforex / TradingView
On shorter timeframes, the asset is no longer moving inside the rising channel. Possibly, the pair may test the resistance level at $2.60 and then resume falling to reach $1.64. A strong signal in to confirm this idea will be a rebound from the resistance line at the RSI, as well as a test of the descending channel’s upside border. However, the bearish scenario may be canceled if the asset grows and fixes above $3.00. in this case, the instrument may form a new bullish impulse.
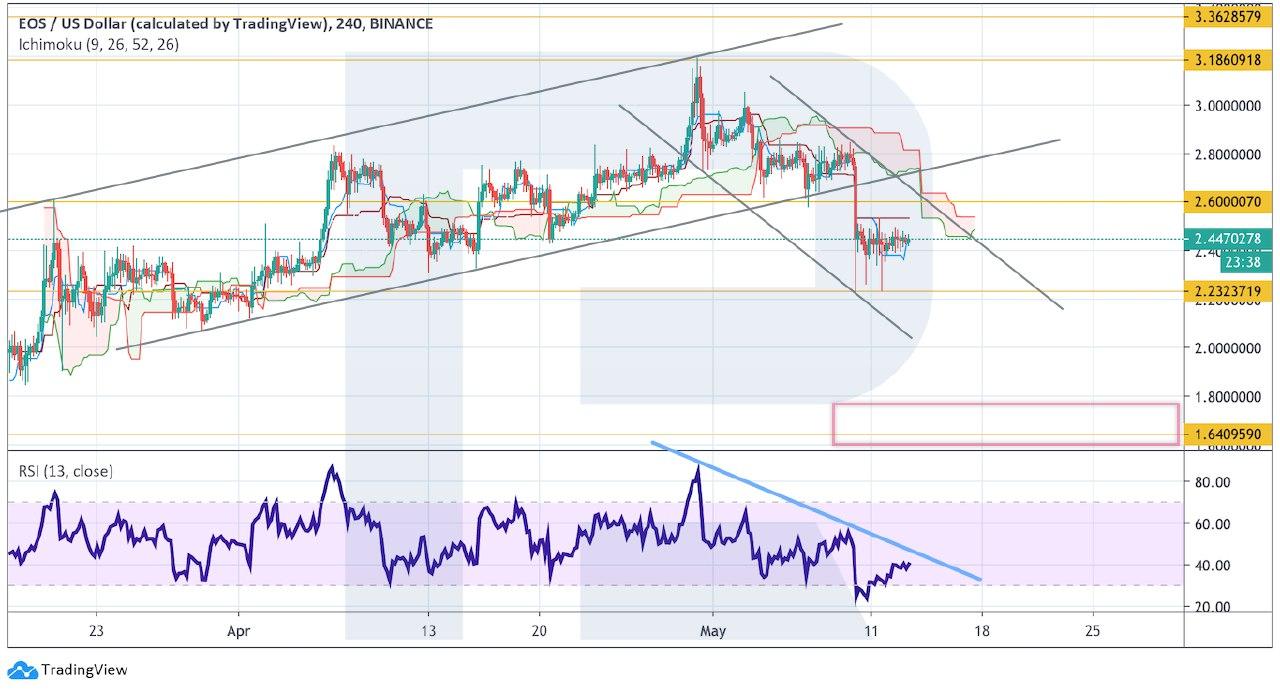
Photo: Roboforex / TradingView
Bitcoin Cash
In the daily chart, Bitcoin Cash is rebounding from the upside border of the Bollinger Bands indicator for the third time; there is a potential for further decline with the target at $136. A strong signal in favor of this idea will be a breakout of the support level and fixation below $198, as well as a breakout of the support line at the RSI. However, the bearish scenario may no longer be valid if the pair breaks the upside border of the Bollinger Bands indicator and fixes above $280. In this case, the instrument may resume the bullish trend with the upside target at $355.
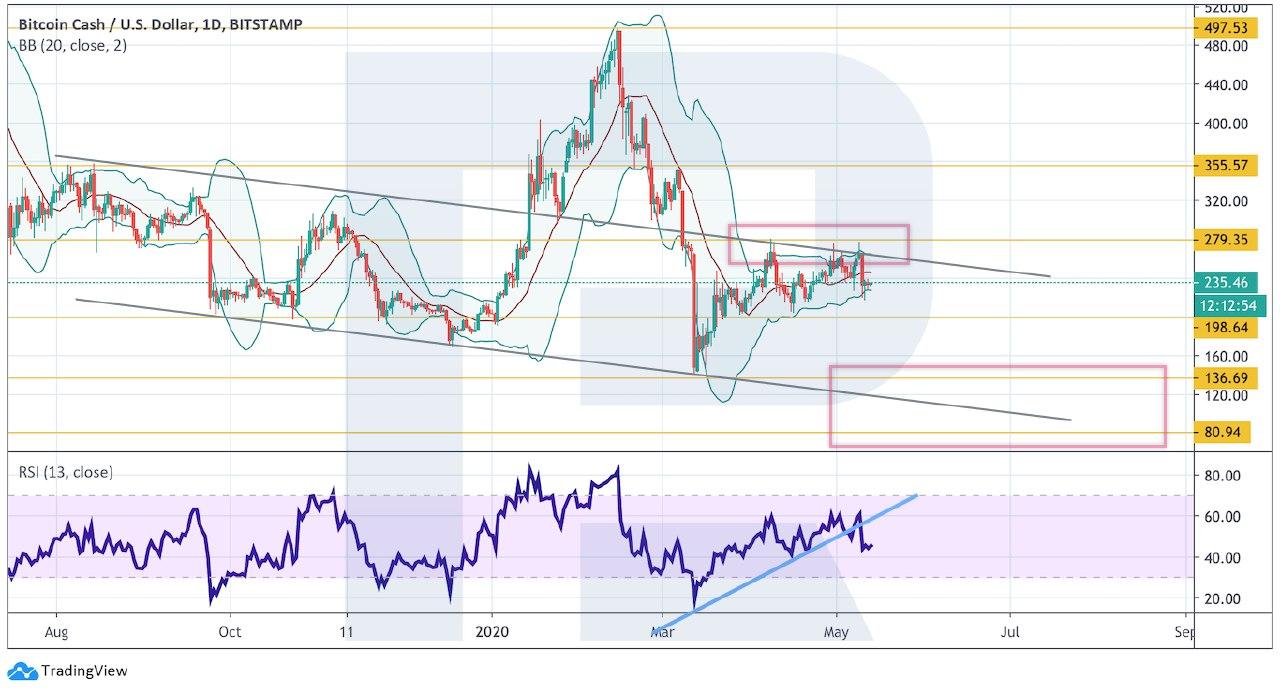
Photo: Roboforex / TradingView
As we can see in the H4 chart, the asset has broken the rising channel’s downside border. According to the key trading idea, the pair is expected to test the broken border along with $260 and then resume falling towards $202. If later this level is broken, the price may continue trading downwards to reach $136. A signal in favor of this scenario will be a rebound from the resistance lien at the RSI. However, this scenario may be canceled if the instrument grows and fixes above $280. In this case, the asset may continue trading upwards with the target at $355.
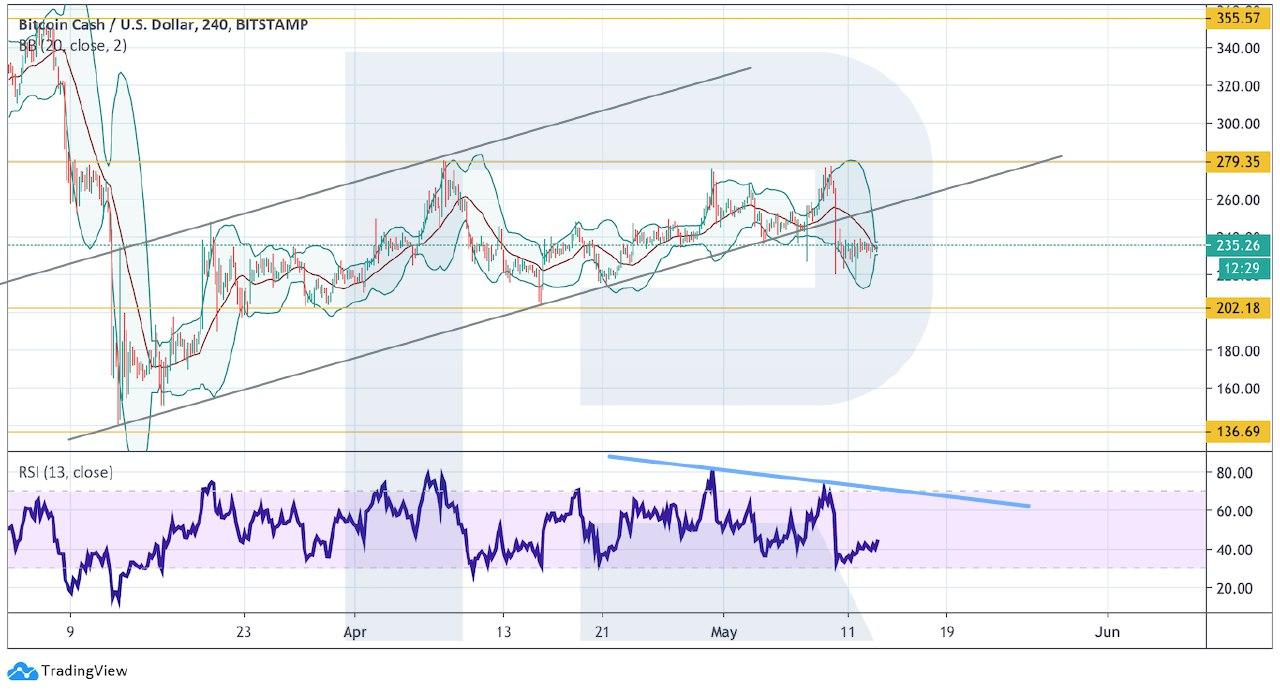
Photo: Roboforex / TradingView
Disclaimer: Coinspeaker is committed to providing unbiased and transparent reporting. This article aims to deliver accurate and timely information but should not be taken as financial or investment advice. Since market conditions can change rapidly, we encourage you to verify information on your own and consult with a professional before making any decisions based on this content.

Dmitriy Gurkovskiy is a senior analyst at RoboForex, an award-winning European online foreign exchange forex broker.


