According to CryptoQuant analysts, the reason is simple. The dollar drop comes from fear, not from growth or easy money. Data shows that as the dollar slipped, gold attracted flows while Bitcoin ETFs saw large outflows. Capital did not rotate into risk assets, but it moved into safety.
When the dollar weakens due to stress and policy rumors, such as talk of yen support actions, Bitcoin trades like stocks, not like gold.
Risk Mood Overrides the Dollar Signal
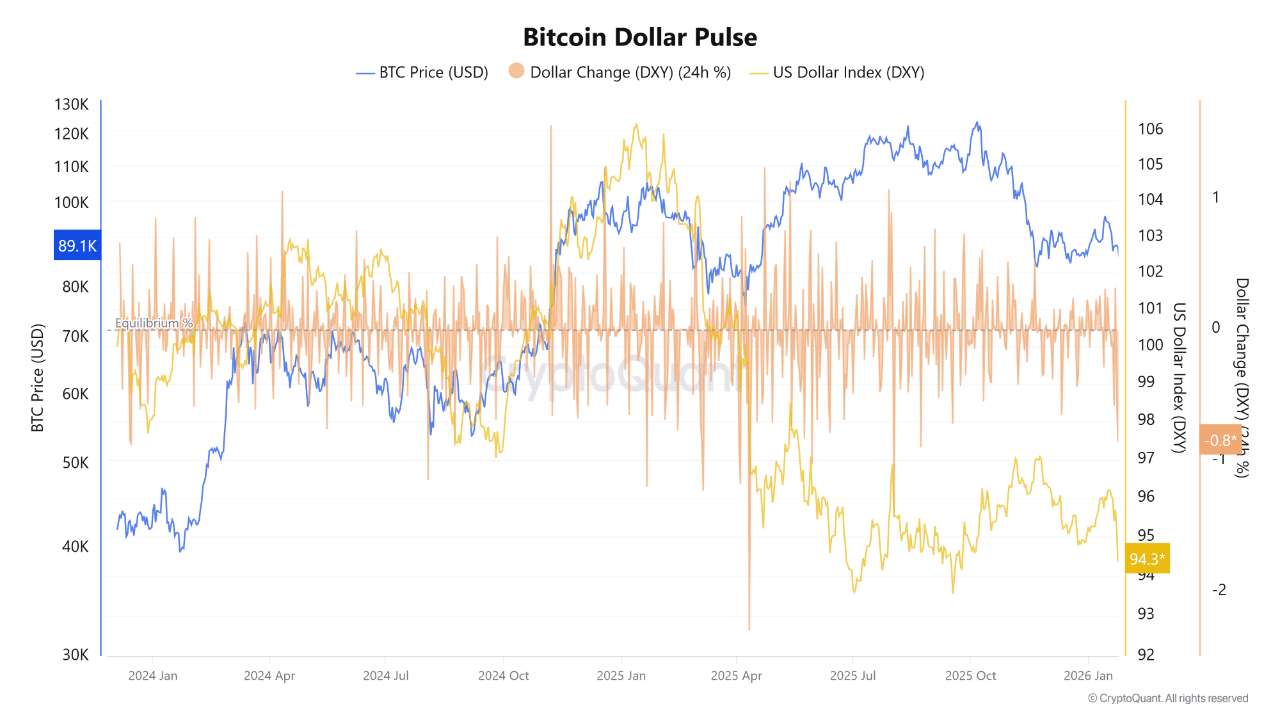
The Bitcoin Dollar Pulse chart shared by CryptoQuant analysts shows that during 2024 and early 2025, Bitcoin rose with a firm or stable dollar. The rally pushed BTC above $100,000 and later near $120,000 while DXY stayed near or above 100. The current phase is different because when DXY breaks down, Bitcoin also pulls back.
BTC dollar pulse chart | Source: CryptoQuant
Analysts claim that the link is not direct and the driver is risk mood. A weak dollar only helps Bitcoin when inflation fear or easy liquidity pushes investors to take risk.
Right now, the move in FX markets is sending money to gold, not to crypto. A weak dollar is only the background and the market is missing risk appetite, added analysts.
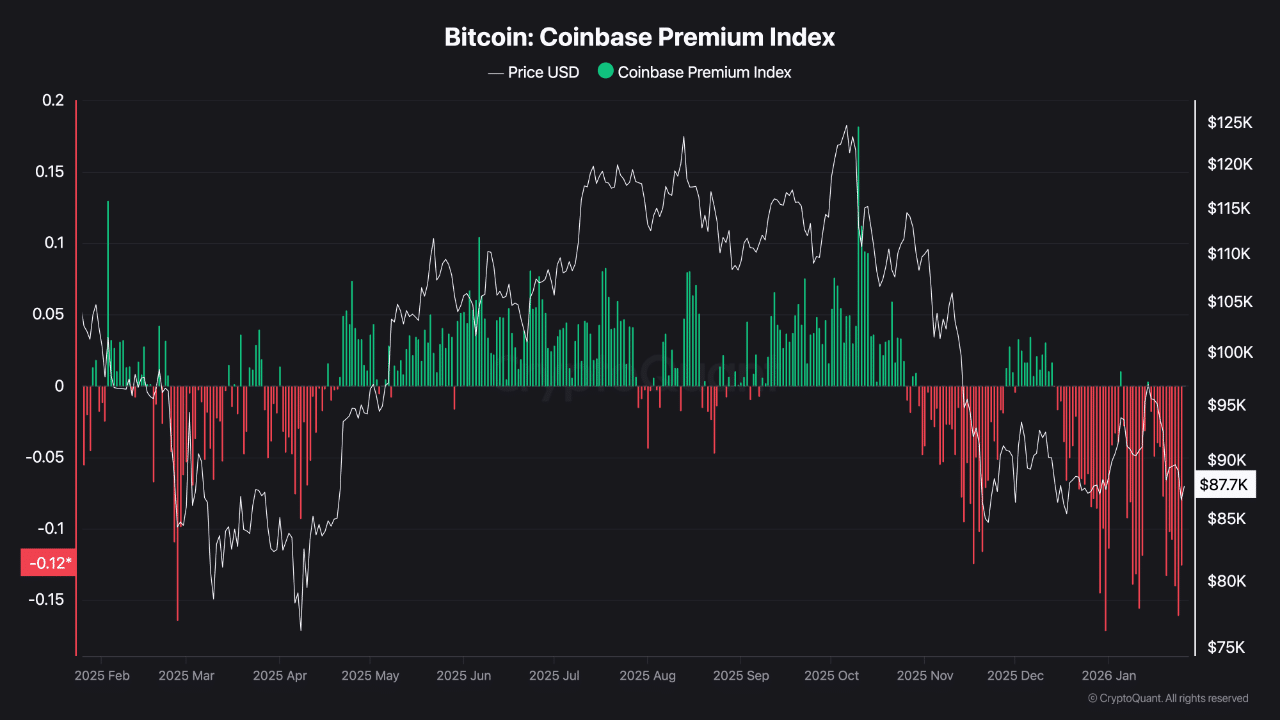
Spot Demand in the US Is Still Missing
The Coinbase Premium Index stays deep below zero as Bitcoin continues to trade at a discount on Coinbase versus offshore exchanges. This points to steady sell pressure from US spot flows.
Even during short bounces, the discount holds which means institutions and long‑term US buyers are not active. In past cycles, a long negative premium indicated weak spot demand and capital moving away from US venues.
Bitcoin Coinbase premium index | Source: CryptoQuant
Without a turn back to positive, upside moves rely on futures and short‑term trades, not on strong accumulation.
Below the 21‑Week Line
Matrixport pointed out that Bitcoin is below its 21‑week moving average, a level near $96,000. This line has defined bull and bear phases for years. When price holds above it, trends stay strong. When price falls below it, deeper pullbacks often follow.
📊Today’s #Matrixport Daily Chart – January 26, 2026 ⬇️
In late 2025, Bitcoin broke under this level and later tried to reclaim it but failed. This rejection keeps Bitcoin in a corrective phase. According to the research firm, the broader range for BTC is between $121,000 in the bullish case and $70,000 zone if stress continues.
Disclaimer: Coinspeaker is committed to providing unbiased and transparent reporting. This article aims to deliver accurate and timely information but should not be taken as financial or investment advice. Since market conditions can change rapidly, we encourage you to verify information on your own and consult with a professional before making any decisions based on this content.
A crypto journalist with over 5 years of experience in the industry, Parth has worked with major media outlets in the crypto and finance world, gathering experience and expertise in the space after surviving bear and bull markets over the years. Parth is also an author of 4 self-published books.