U.S. jobless claims were 38K higher than the expected 846K and remained at 884K. Major pairs against the US Dollar may continue to gain as the expected US Core CPI data is expected to be lower than the previous, thus Core CPI MoM as per August is expected to be at 0.2% versus July’s 0.6%, CPI Mom as per August is expected to be 0.3% vs the previous announced 0.6%.
Another data to trace today is Federal Budget Balance per August, the expected number is -245B and is far below the July’s -63.08B.
Possible continuation of the bull run for Kiwi is also supported by its price action on Fibonacci levels. By the time of writing this article NZD/USD quote on Overbit is at 0.66904 level which is a minor short-term resistance, though the pattern still looks bullish as Fibo 0.618 has been already tested and the impulse of September 8 demonstrates a possible formation of a new bullish run. See the chart below to trace Fibonacci 0.618 tests by Kiwi/USD.
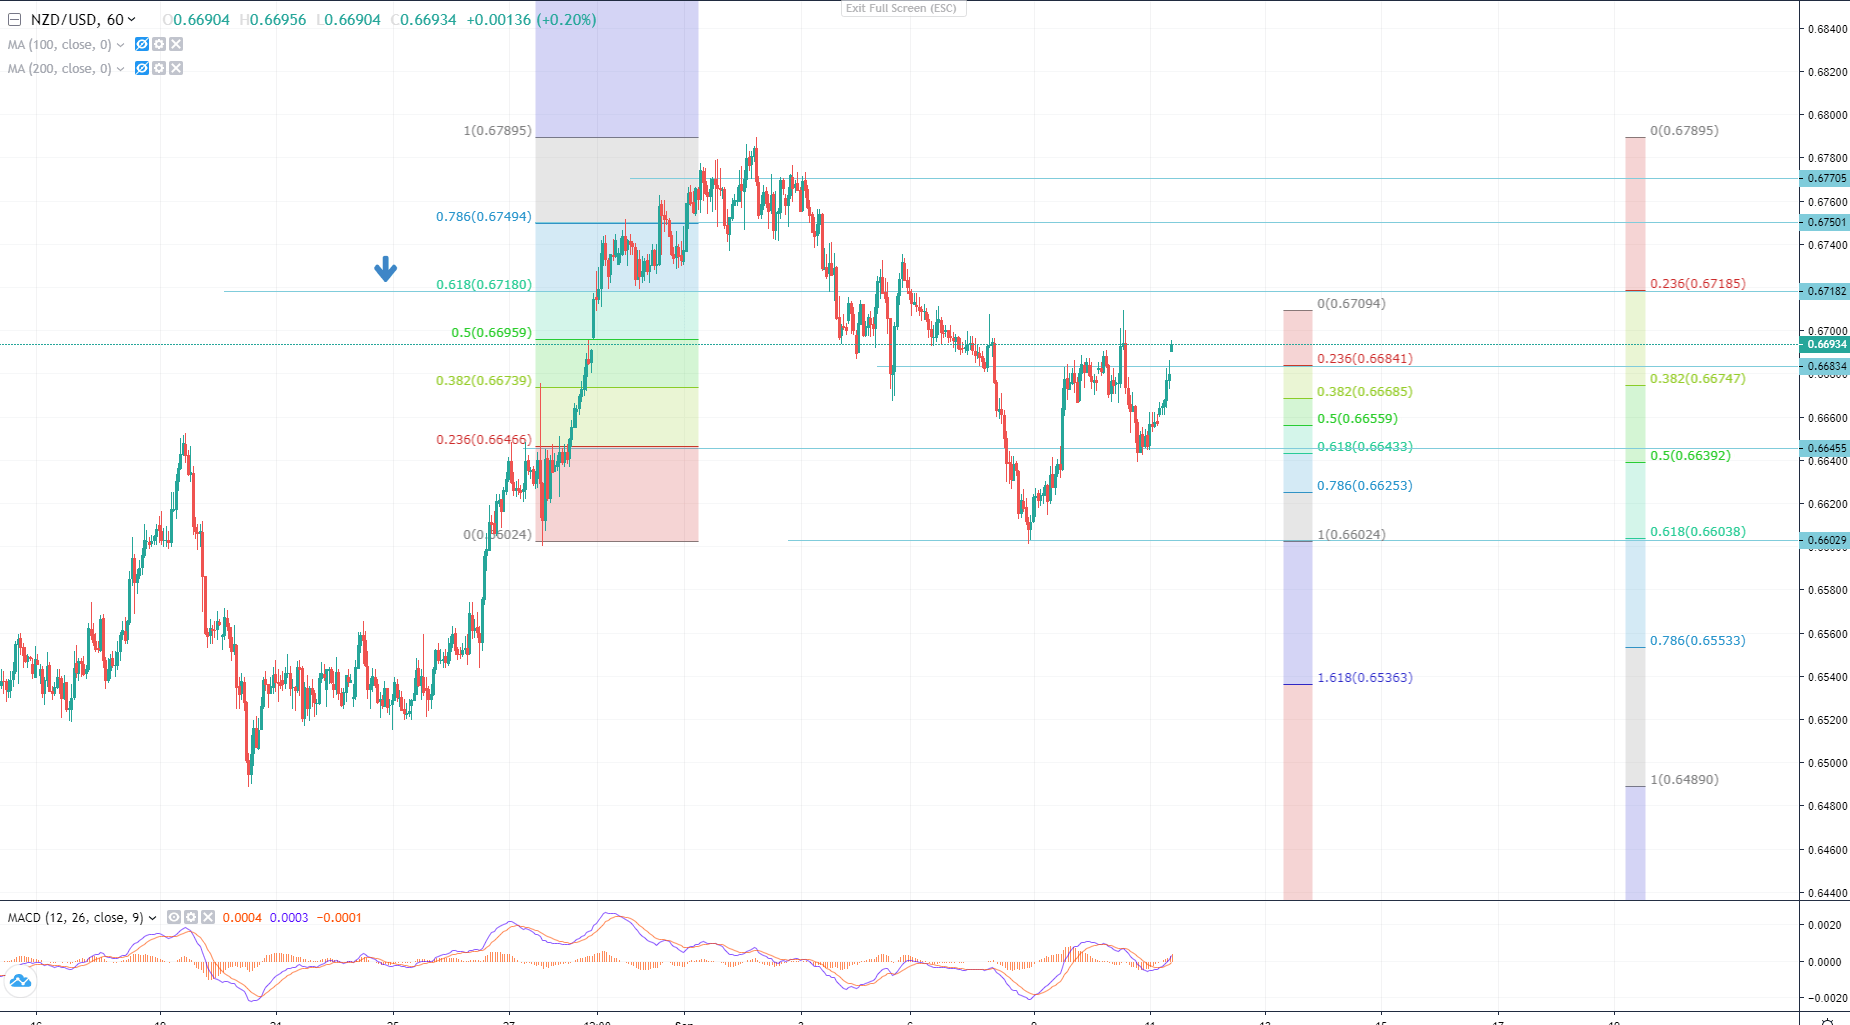
There are several key levels and patterns to watch here. Fibonacci 0.236 of the last bullish run of September 8, which has also formed a short-term support at 0.66834. Fibonacci 0.236 at 0.67182 of the bullish run of August 20, which also is a Fibonacci 0.618 of the bearish trend (correction) of September 2. There is a possibility of a formation of two Gartley patterns on an hourly chart, you should consider as well.
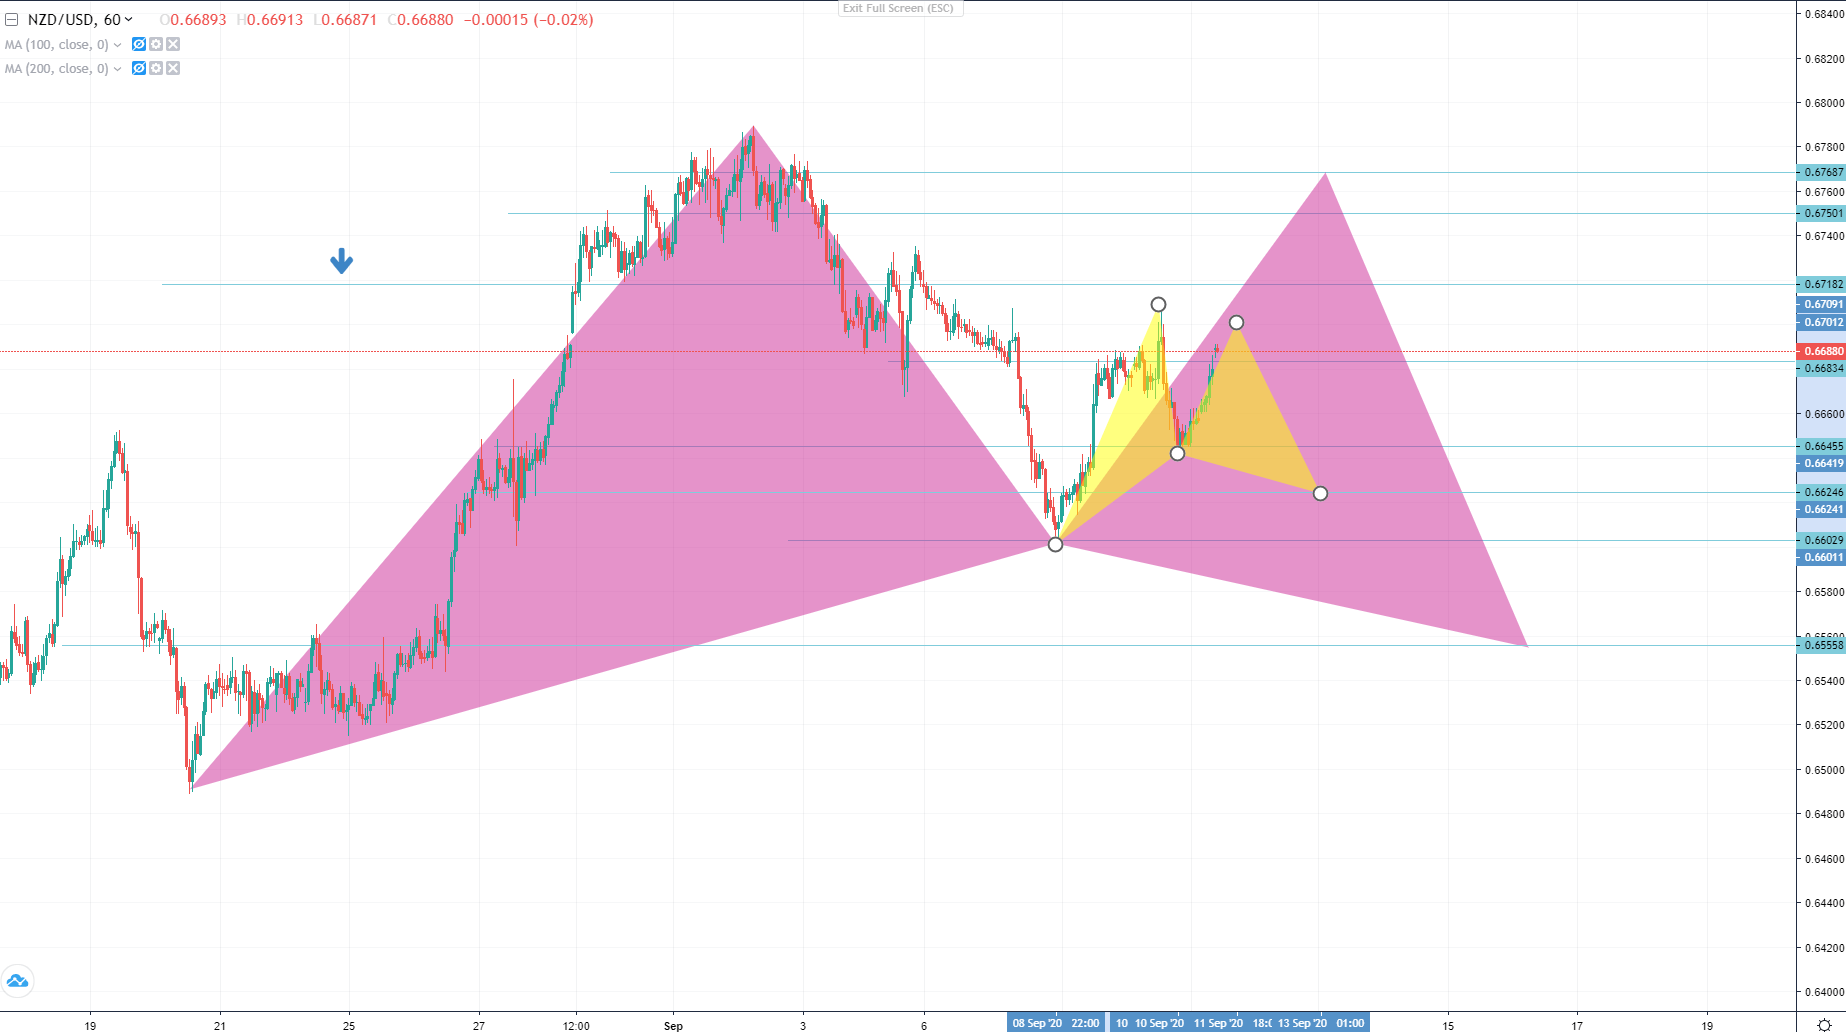
In general, NZDUSD still looks bullish, the daily chart shows that Kiwi is still climbing higher in an uptrend channel with higher highs and higher lows, from Elliott Wave theory prospective, the September 2 impulse might be considered as a 3rd wave and Kiwi might drop to test the lower edge of the channel to continue the bullish run to form wave 5 and then a massive correction is expected, however after the 5th wave confirmation NZDUSD might also show a greater impulse similar to the one in the wake of April – May uptrend channel.

NZDUSD chart by TradingView.
Disclaimer: Coinspeaker is committed to providing unbiased and transparent reporting. This article aims to deliver accurate and timely information but should not be taken as financial or investment advice. Since market conditions can change rapidly, we encourage you to verify information on your own and consult with a professional before making any decisions based on this content.

Senior Vice President at Overbit. Technical analyst, crypto-enthusiast, ex-VP at TradingView, medium and long-term trader, trades and analyses FX, Crypto and Commodities markets.