Stellar (XLM) Price Analysis: Trends of October 4–10, 2018
Should the price break the demand level of $0.24 the downtrend movement will be experienced and this will expose it to another demand level of $0.21.
By Azeez Mustapha
Updated
2 mins readPhoto: Shutterstock
Key Highlights:
Downtrend movement may be experienced;
there is a possibility of further consolidation;
traders should patiently watch out for the breakout.
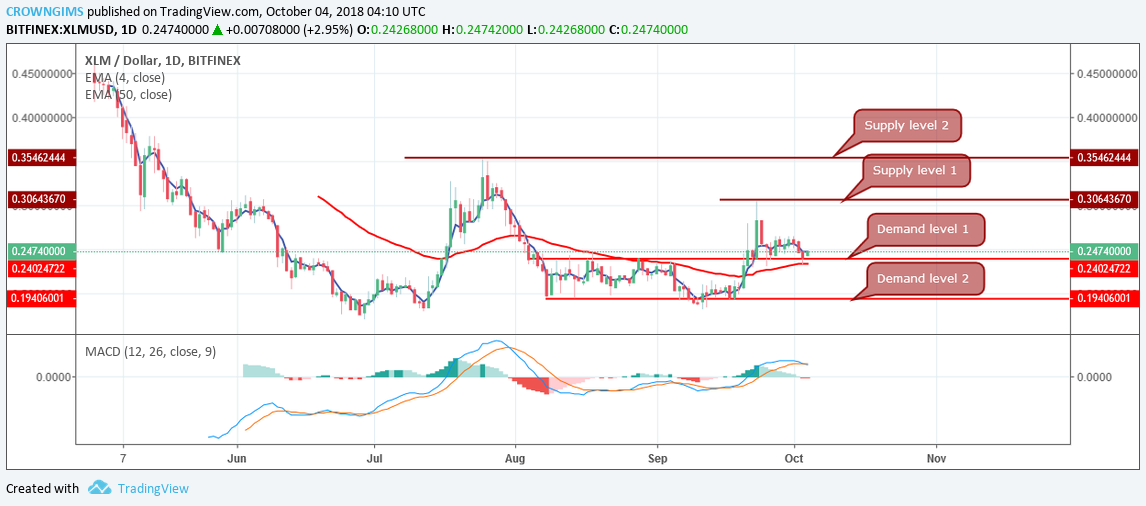
XLM/USD Long-term Trend: Ranging
Supply levels: $0.30, $0.35, $0.45
Demand levels: $0.24, $0.21, $0.18The cryptocurrency was pushed up to break both supply levels of $0.21 and $0.24 last week. The price reached the upper supply level of $0.30 before it was pushed back by the bears to retest the demand level of $0.24.
XLM/USD enters consolidation in its short-term outlook. After a bearish run to the demand level of $0.24, rejection to the further downward movement was seen with the formation of a pin bar and a bullish candle as the bulls made a gradual return.
The price is below 4-day EMA and the 50-day EMA is below the price that suggests a continuation of sideways movement. However, the MACD indicator is above zero level with its signal lines pointing to the south which indicate selling signal and this is also supported by the opening bearish candle formed on the daily chart at the demand level of $0.24. In case the bears increase the momentum the price would break the demand level of $0.24 and expose to the demand level of $0.21.
XLM/USD Price Medium-term Trend: Ranging
Stella is ranging on the medium-term outlook. The sideways movement commenced shortly after the bulls broke out the supply level of $0.21 and the price was pushed up toward the supply level of $0.3 where it was rejected by the bears’ pressure to the demand level of $0.24.
The Bulls and the Bears could not increase their momentum to rally to the supply level of $0.3 and to break the demand level of $0.24 respectively and it started moving sideways.
Should the price break the demand level of $0.24 the downtrend movement will be experienced and this will expose it to another demand level of $0.21. The price is between 4-day EMA and 50-day EMA while 50-day EMA is above the price, with the MACD below zero and its signal lines point to the north indicates the possibility of the uptrend movement. Traders should patiently watch out for the breakout.
Azeez Mustapha is a specialist in Computer Studies (including DTP), Forex and Crypto trading professional. Being expert technical and currency analyst, as well as experienced fund manager and author of several books, Azeez places strong focus on crypto market studies conducting comprehensive price analyses and sharing forecasts of presumptive market trends.

 The cryptocurrency was pushed up to break both supply levels of $0.21 and $0.24 last week. The price reached the upper supply level of $0.30 before it was pushed back by the bears to retest the demand level of $0.24.
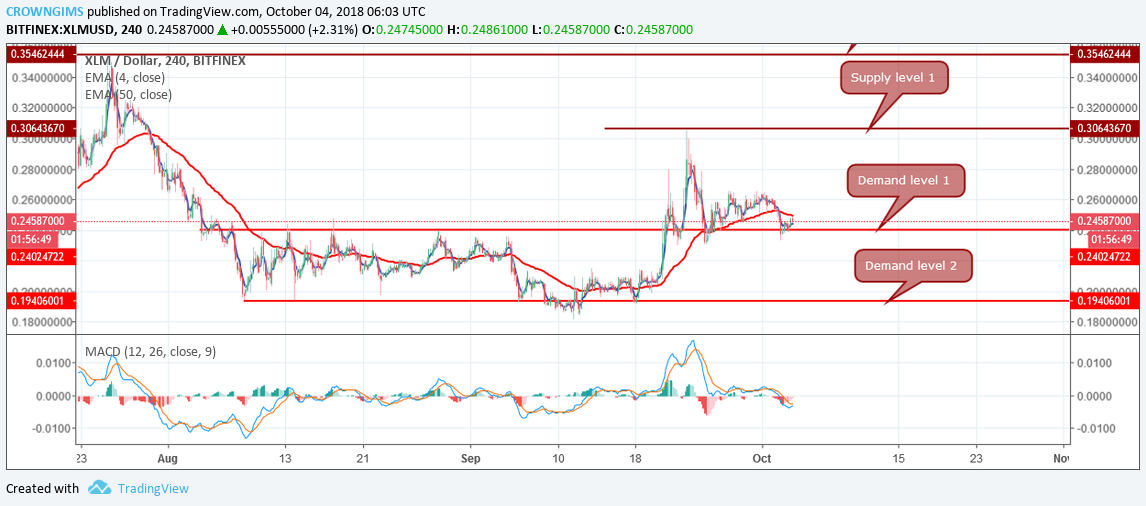 Stella is ranging on the medium-term outlook. The sideways movement commenced shortly after the bulls broke out the supply level of $0.21 and the price was pushed up toward the supply level of $0.3 where it was rejected by the bears’ pressure to the demand level of $0.24.