This historic surge comes amid a strong monthly rally of over 25%, with BTC gaining 3% in the past 24 hours alone. At the time of writing, the flagship cryptocurrency is trading at $110,751.70, entering uncharted territory.
Analyst Insights: What’s Next for BTC?
According to prominent crypto analyst Ali Martinez, Bitcoin is now in price discovery mode. He identified the next critical resistance levels at $116,000, $126,000, $136,000, and $148,000 — a series of psychological and technical barriers that could shape BTC’s medium-term trajectory.
#Bitcoin$BTC is trading at new all-time highs, entering price discovery. The next key levels to watch are $116,000, $126,000, $136,000, and $148,000! pic.twitter.com/yh3ShJ5X59
Meanwhile, on-chain data provider Santiment noted the irony of Bitcoin’s ATH arriving just six weeks after maximum market fear, largely fueled by geopolitical tariff concerns.
The recent 90-day pause in US-China trade tensions helped ease sentiment, but the real momentum has come from institutional heavyweights.
Institutional Inflows
Santiment added that institutional flows have also been crucial in pushing BTC to its new heights:
BlackRock’s spot Bitcoin ETF (IBIT) has surpassed $20 billion in assets under management.
Fidelity and Ark Invest have reported record inflows as well.
Spot ETF holdings across the board have hit new highs, reflecting the growing appetite from both retail and institutional investors.
Meanwhile, analyst Crypto Dan emphasized that while BTC has hit ATH, the market remains in a non-overheated state as the funding rate shows only mild optimism among long traders.
Further, short-term capital inflows (from coins held between 1 week and 1 month) are far lower than in past peaks. Profit-taking by whales and short-term holders has been minimal, unlike in March or November 2024.
BTC Price Analysis: What to Expect?
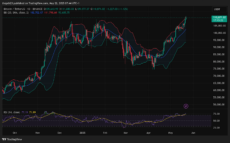
As per the chart below, the Relative Strength Index (RSI) on the daily chart stands at 77.19, clearly in overbought territory. While this traditionally hints at a potential short-term pullback, in strong bull markets, RSI can remain elevated for extended periods.
BTC Daily Chart | Source: TradingView
On the other hand, the Bollinger Bands (BB) indicate a sharp expansion, reflecting increased volatility. The price is hugging the upper band at $111,798.60, suggesting strong bullish pressure.
The middle band, which represents the 20-day SMA, is now at $102,702.17, providing a key support level in case of retracements.
Note: this is a sponsored message from our partners
🔥 Don’t Miss Out on Massive Rewards
As Bitcoin achieves a new ATH, BTC Bull ($BTCBULL), a meme-powered token built on Ethereum, is gathering attention in a hurry with its ongoing presale. Created to rally the crypto community behind Bitcoin’s march to $250,000 and higher, $BTCBULL has significant utility.
BTCBULL is here to amplify the momentum and reward holders every step of the way and a massive BTC airdrop awaits the strongest hodlers when BTC hits $250,000.
Every time Bitcoin gains another $25K in value, BTCBULL either burns a portion of its token supply or airdrops BTC to holders, fueling scarcity and value. The holders of the token are eligible to a 230% annual average return.
BTCBULL Presale Details
The BTCBull team has raised a massive $6.1 million in its ongoing presale, with over 2 days and 2 hours until the next price increase.
Disclaimer: Coinspeaker is committed to providing unbiased and transparent reporting. This article aims to deliver accurate and timely information but should not be taken as financial or investment advice. Since market conditions can change rapidly, we encourage you to verify information on your own and consult with a professional before making any decisions based on this content.
A crypto journalist with over 5 years of experience in the industry, Parth has worked with major media outlets in the crypto and finance world, gathering experience and expertise in the space after surviving bear and bull markets over the years. Parth is also an author of 4 self-published books.