Chainlink (LINK) Flatlines: Major Missing Piece — Retail
Sustained negative exchange netflows (-100K LINK/week) and persistent withdrawal activity suggest that LINK whales are preparing for a future breakout.
Hovering between $12 and $15 for much of 2025, LINK is flashing signs of a coiled spring that lacks one crucial trigger, i.e., retail participation.
Why is LINK Moving Sideways?
According to analyst Banker, LINK’s sideways movement is a product of aggressive institutional accumulation, evidenced by consistent negative exchange netflows (-100,000 LINK per week) and surging withdrawal transactions, particularly since Q4 2024.
The strategic buildup has drained exchange reserves by roughly 40% year-to-date, signaling a clear intent by whales to corner supply without sparking premature price spikes.
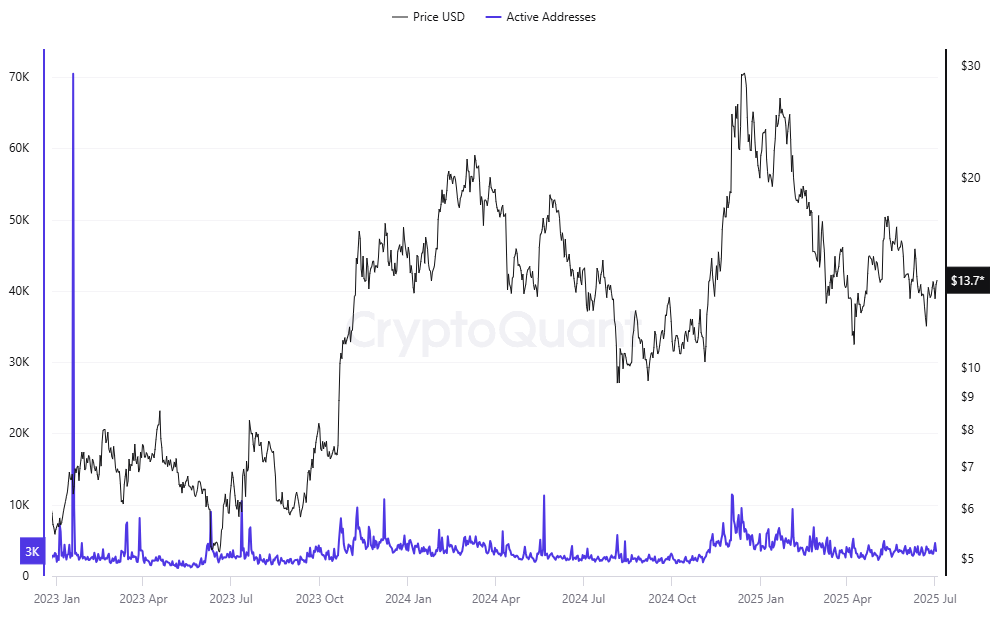
But while whales have been busy building positions, retail traders appear to have tuned out. On-chain data shows flat active addresses (28K–32K/day) and stagnant transaction counts (9K/day), despite Chainlink’s expanding utility across oracle integrations.
Chainlink Active Addresses | Source: Banker
Even sharp price movements, like March 2025’s +5M LINK exchange inflow spike, were short-lived, highlighting retail’s minimal role in long-term momentum.
The Missing Catalyst
According to Santiment, only 32% of the total Chainlink supply is held by the top 10 wallets — a relatively decentralized profile compared to coins like Shiba Inu (62%).
🐳 Here are the percentages of supply held by various large cap assets' top 10 whales. USD Coin has just 27% of its supply held by its top 10 wallets, and Chainlink's is relatively low at 32%. Shiba Inu notably has the most centralized, with 62% of its supply held by its 10… pic.twitter.com/jdFUcmT6uC
While this reduces systemic risk from whale exits, it also means the network’s price trajectory depends heavily on broad retail engagement. Without it, the current accumulation phase may wither away soon.
Analyst Ali Martinez believes that holding above $12 will keep LINK positioned for a breakout toward $18–$20, aligning with the broader ascending channel, which shows LINK pressing against mid-channel resistance.
A break above $15.64, the local Fib 0.786 level, could open the door toward the 1.618 extension at $18.56, with further upside into the $23.29 and $28.02 zones (2.618 and 3.618 Fib levels respectively) if momentum follows through.
On the daily chart, the Balance of Power (BoP) remains volatile and neutral, reflecting the low-conviction chop between $12–$15. However, On-Balance Volume (OBV) still trends upward, suggesting steady accumulation behind the scenes.
BoP and OBV Levels on LINK 1D Chart | Source: TradingView
Should LINK lose the $12 level, support lies near $10.91 (the local Fib base), followed by a broader downside into the $10.02–$9 region, as seen on the ascending channel’s lower boundary.
Disclaimer: Coinspeaker is committed to providing unbiased and transparent reporting. This article aims to deliver accurate and timely information but should not be taken as financial or investment advice. Since market conditions can change rapidly, we encourage you to verify information on your own and consult with a professional before making any decisions based on this content.
A crypto journalist with over 5 years of experience in the industry, Parth has worked with major media outlets in the crypto and finance world, gathering experience and expertise in the space after surviving bear and bull markets over the years. Parth is also an author of 4 self-published books.