SUI’s community sentiment on CoinMarketCap shows a strong bullish outlook.
21Shares recently partnered with Sui to drive global Layer-1 adoption.
Analysts indicate a bull flag pattern, known for leading breakout rallies.
Sui blockchain’s native token, SUI SUI$0.9224h volatility:4.0%Market cap:$3.53 BVol. 24h:$469.44 M
, is recording strong bullish sentiment on CoinMarketCap’s community sentiment indicator. Currently trading around $3.40, the token has risen by nearly 1.7% in the past 24 hours.
After a sharp rally of over 75% in the second half of April, SUI has entered a period of consolidation, forming a textbook bull flag pattern since May-start. According to analysts on X, this healthy pause could lead the token to another strong upward move.
Popular trader and podcast host Scott Melker recently remarked that SUI shows “significant upside potential”. The optimism is further supported by a 16% jump in 24-hour trading volume, reflecting renewed market interest.
SUI Showing Strong Strength
This bullish momentum coincides with 21Shares’ last week announcement of entering a strategic partnership with Sui to enhance global access and adoption of the Layer-1 network.
Just weeks prior, Grayscale had launched the SUI Trust to expand the token’s institutional adoption. The protocol also joined hands with xPortal and xMoney to enable a virtual Mastercard rollout across Europe.
Sui network also recently secured its place among the top 10 Layer-1 blockchains, with over $1.74 billion in total value locked (TVL). Notably, the past month alone saw TVL rise by 56%, underscoring growing trust in the ecosystem.
SUI Price Outlook
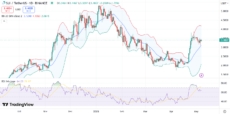
On the daily chart, SUI is trading within a bull flag pattern. The sharp rally from around $2.60 to $3.80 in late April forms the pole of the pattern, measuring $1.20 in height.
— The Wolf Of All Streets (@scottmelker) May 7, 2025
The current consolidation resembles a descending flag structure, with resistance near the $3.50 level. If SUI manages to sustainably break above this line, traders could set the next upside target around $4.70. However, the pattern only remains valid if the token holds above the flag’s lower boundary.
Meanwhile, the RSI is currently sitting around 64, showing that the 11th largest cryptocurrency is nearing the overbought region. Notably, traders should watch any RSI move above 70 for potential divergence, which often leads to reversals.
SUI price chart with RSI and Bollinger bands | Source: TradingView
Bollinger Bands suggest SUI remains in an upward bias, as it trades above the mid band (20-day simple moving average) around $3.12. While the token has retreated from the upper band, it’s still within a healthy uptrend channel.
A renewed push to the upper band could indicate another wave of buying pressure. If SUI crosses the $3.50 resistance, it could test the $4.70 region.
Disclaimer: Coinspeaker is committed to providing unbiased and transparent reporting. This article aims to deliver accurate and timely information but should not be taken as financial or investment advice. Since market conditions can change rapidly, we encourage you to verify information on your own and consult with a professional before making any decisions based on this content.
A crypto journalist with over 5 years of experience in the industry, Parth has worked with major media outlets in the crypto and finance world, gathering experience and expertise in the space after surviving bear and bull markets over the years. Parth is also an author of 4 self-published books.