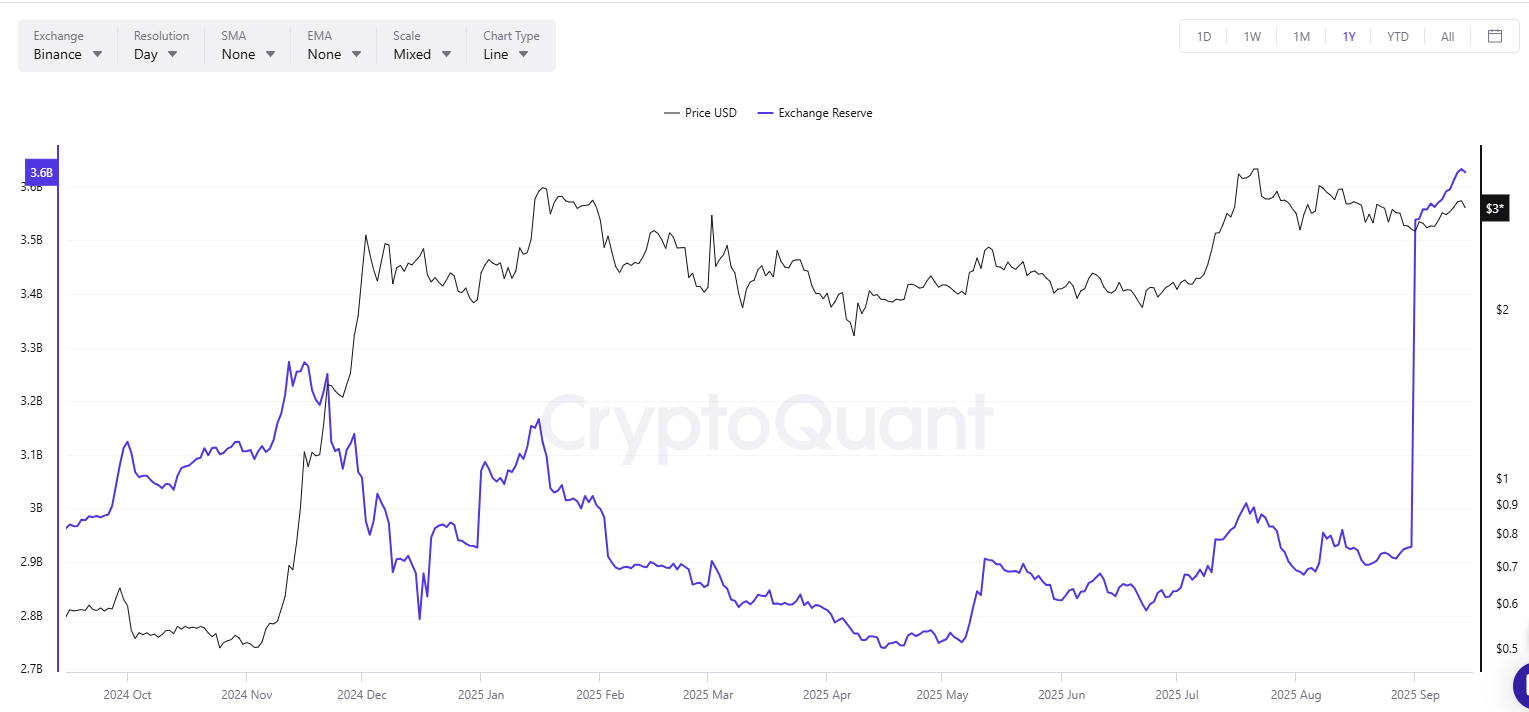
Meanwhile, since September-start, XRP exchange reserves have also jumped 20%, according to CryptoQuant. This rise suggests that more tokens are moving onto exchanges, a sign that investors may be preparing to cash out in the short term.
XRP touched a monthly high of $3.18 on Sept. 13, briefly pushing its market cap above $185 billion. This resulted in top cryptocurrency overtaking Citigroup in overall valuation, placing it ahead of major global companies.
However, profit-taking quickly followed. At the time of writing, XRP is trading at near $3.02, down about 2% over the last 24 hours. The selling pressure coincided with a 15% drop in daily trading volume, according to CoinMarketCap.
XRP Price to $3.60?
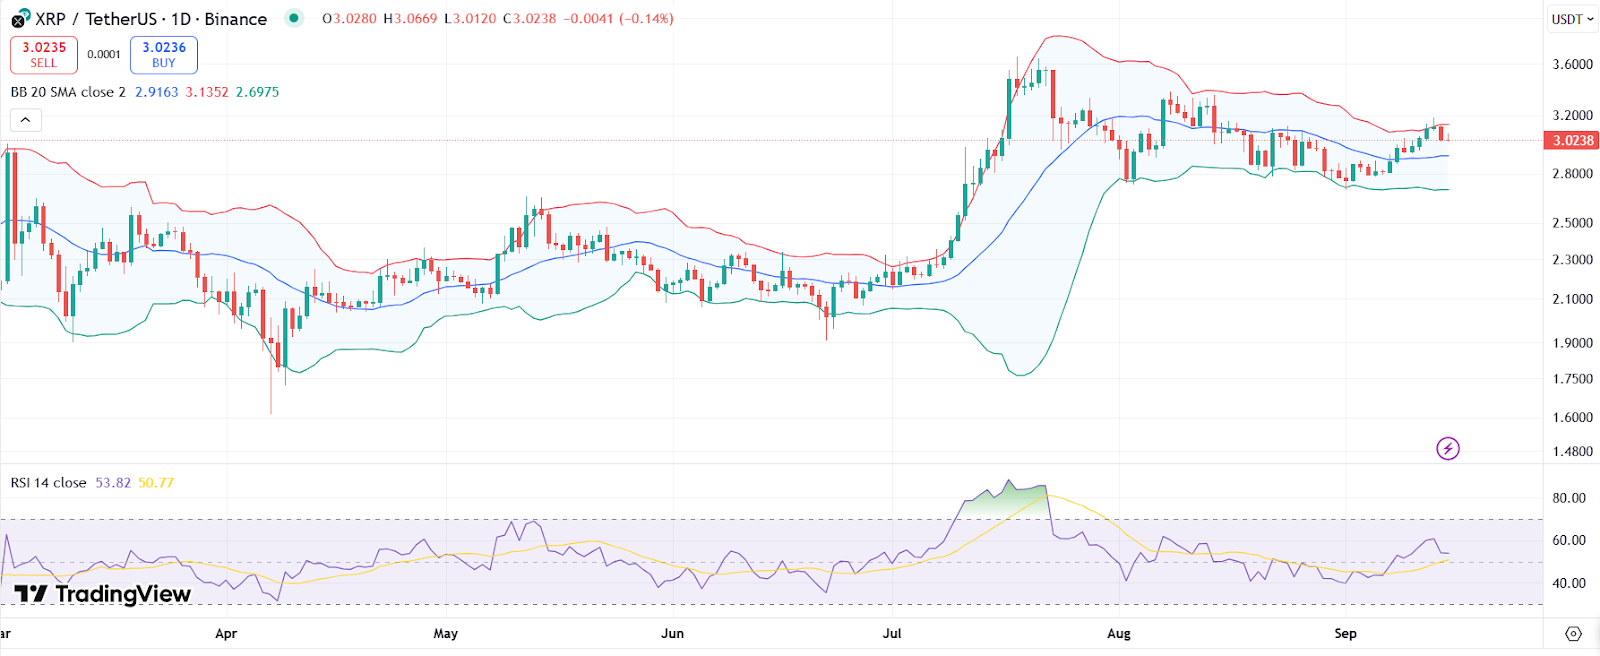
On the daily chart, XRP price is consolidating near the middle Bollinger Band around $3.02, indicating a period of reduced volatility. If it moves above the upper band near $3.20, investors could show renewed bullish momentum.
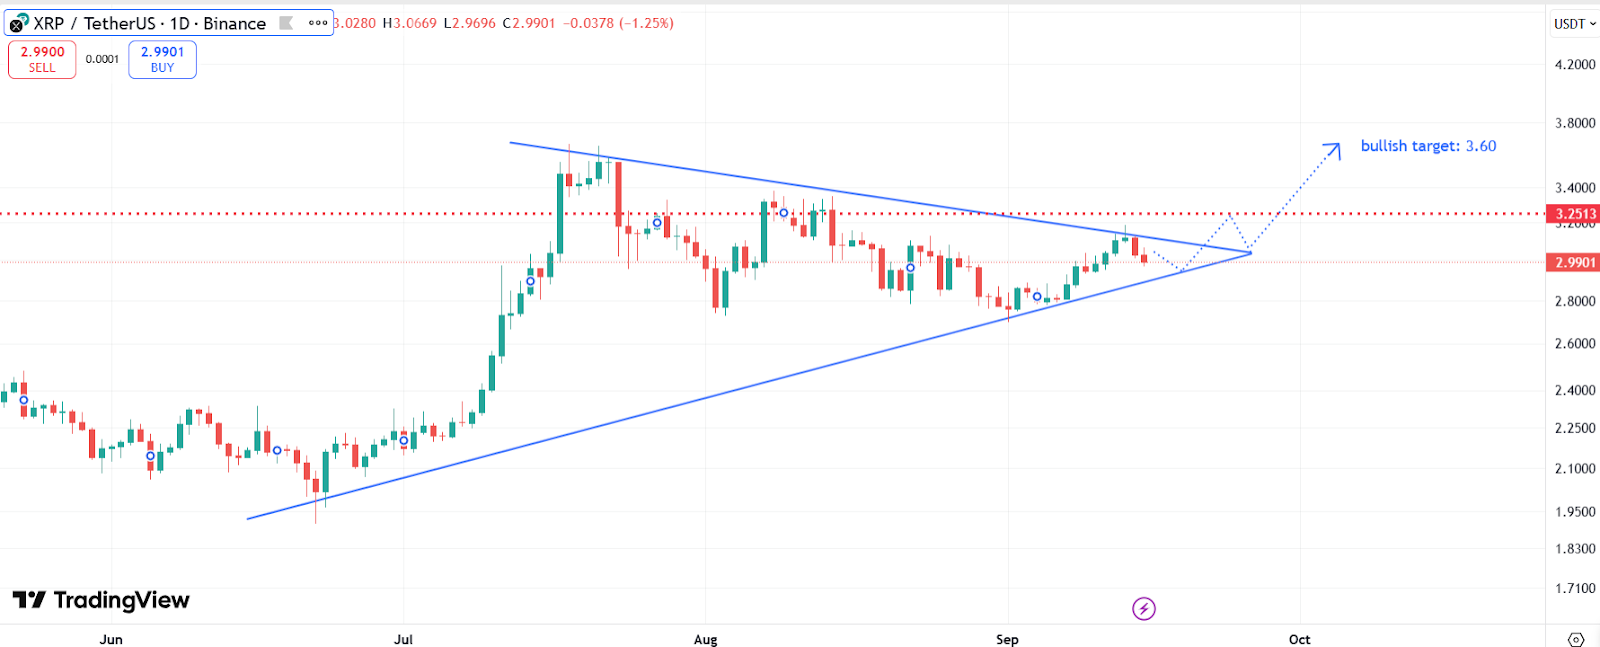
XRP price chart with symmetrical triangle pattern | Source: TradingView
The RSI is suggesting neutral market conditions. A push above 60 would strengthen a bullish case. However, if XRP price breaks below the lower Bollinger Band at $2.70, it may lead to further losses.
Meanwhile, the daily XRP price chart is on the verge of breaking out of a 2-month-long symmetrical triangle pattern. A decisive close above $3.25 could target resistance at $3.60.
XRP price chart with symmetrical triangle pattern | Source: TradingView
Despite near-term volatility, analysts remain optimistic about XRP’s future, calling it one of the best crypto to buy this quarter. Market watchers believe an upcoming Federal Reserve interest rate decision could spark a wider altcoin rally.
Institutional interest is also growing. Fifteen XRP ETF proposals are reportedly under review, with experts estimating an 87% chance of approval by the end of 2025. If these ETFs receive the green light, crypto strategists project XRP could climb to $5 by late 2025.
Disclaimer: Coinspeaker is committed to providing unbiased and transparent reporting. This article aims to deliver accurate and timely information but should not be taken as financial or investment advice. Since market conditions can change rapidly, we encourage you to verify information on your own and consult with a professional before making any decisions based on this content.
A crypto journalist with over 5 years of experience in the industry, Parth has worked with major media outlets in the crypto and finance world, gathering experience and expertise in the space after surviving bear and bull markets over the years. Parth is also an author of 4 self-published books.