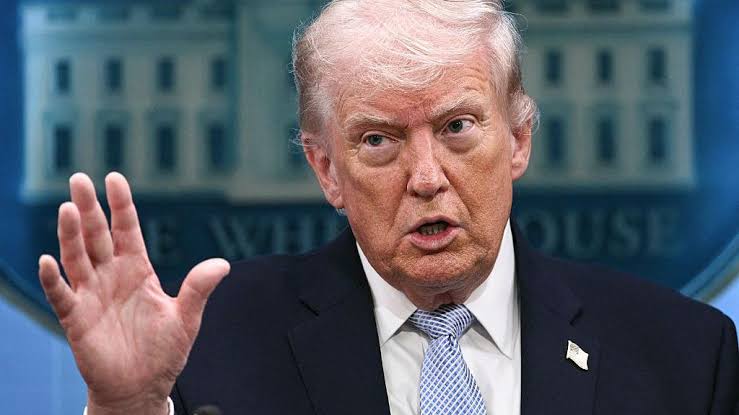
Bitcoin (BTC) briefly reached above $65,000 on July 15, 2026, according to CoinGecko data, with the rally occurring alongside softer-than-expected US inflation data that eased pressure on the Federal Reserve, even as fresh US–Iran airstrikes continued following President Trump’s strike orders the prior weekend.
The BTC price had already recovered above $63,000 within days of those strikes, and the lack of downside movement whenever the latest conflict is reported in the Middle East suggests investors are reacting less out of fear.
This is not simply a resilience narrative. It is evidence that the geopolitical risk premium attached to Iran headlines has materially decayed, with the shock absorption now occurring inside derivatives markets rather than through spot capitulation.
With the $65,000 level touched, a flip to support on the daily close is prompting several analysts to call for a $70,000 retest this week as the bullish structure continues to form on the BTC chart.
Iran Airstrikes: The Diminishing Shock Response in BTC Price
Complex inverse H&S breakout with a target north of $70K.
The shakeout into CPI formed a second right shoulder with a perfect retest of the diagonal, then it followed through with a clean break above the horizontal neckline.
The contrast with the June 2025 Iran episode is instructive. When similar strikes hit that summer, BTC fell below $99,000, its lowest level since May 2025, with more than $1Bn in crypto liquidations in 24 hours, over 95% of which were longs, as reported by CNBC.
This July, total BTC liquidations tied to Iran headlines were modest compared with the earlier June 2025 Iran shock, consistent with trimming rather than capitulation.
The geopolitical risk premium has not disappeared; it has migrated. Derivatives data showed the impact flowing into options-implied volatility and put skew rather than triggering broad spot deleveraging.
Yet the highest 24-hour BTC options volume sat at the $80,000 call strike, a positioning pattern that signals traders are hedging near-term downside while remaining structurally positioned for upside.
As BeInCrypto’s Darryn Pollock wrote on July 15, “traders appear to be growing desensitized to the tit for tat in the Middle East rather than panicking every time tensions flare.”
The weekend microstructure reinforces this: BTC remains the first target for panic flows, but those flows have been shallower and shorter-lived with each successive Iran cycle.
South Korea: KOSPI Bear Market Accelerates Crypto Rotation
BLOODBATH IN SOUTH KOREA AGAIN 🚨
The KOSPI just crashed -5.66%, wiping out nearly ₩300 trillion from it's market value in just last 2 hours. pic.twitter.com/n7ERq1eUtq
The most structurally significant flow data in this cycle is coming from South Korea. The KOSPI has entered a technical bear market, down more than 20% from its June record. Samsung and SK Hynix together account for roughly half the index’s total weight. eToro market analyst Zavier Wong noted that a sharp swing in either name now drags the whole index with it.
SK Hynix’s chart illustrates the AI valuation debate in compressed form. The stock climbed approximately 233% from the start of 2026 to a record high on June 25 before retreating more than 34% by July 13. Its $26.5Bn American depositary receipt (ADR) listing on Nasdaq on July 10 – one of the largest foreign listings in US history has only sharpened investor scrutiny over how much AI memory chip demand is already priced in.
As the KOSPI rout deepened, trading volume on Upbit, South Korea’s largest crypto exchange, surged 1,318% in 24 hours to $4.2Bn, according to BeInCrypto. XRP recorded higher trading volume on Upbit than Bitcoin did during that window, a data point consistent with altcoin rotation signals visible elsewhere: the Altcoin Season Index has climbed to 58, while Bitcoin dominance has slipped toward key support.
The quality of those Korean flows warrants scrutiny. Korea’s Financial Supervisory Service (FSS) flagged that 1.2 million leveraged accounts triggered margin calls during the same period, a reminder that a portion of the Upbit volume surge reflects forced selling from equity margin calls being recycled into crypto, not purely conviction-driven rotation. The two dynamics are not mutually exclusive, but conflating them overstates the bullish signal.
— Crypto News Hunters 🎯 (@CryptoNewsHntrs) July 15, 2026
The analytical question is no longer whether crypto reacts to Iran headlines; it is whether the bid arriving into BTC and altcoins represents durable rotation or exhaustion-driven allocation.
As Pollock characterized it in the BeInCrypto piece, “Crypto looks less like an asset caught in the crossfire. It looks more like the place traders go when headlines get tiring, whether from Tehran or Seoul’s chip floor.”
That framing cuts both ways. An exhaustion bid can support prices in the near term while building fragile positioning that unwinds quickly if a genuinely novel shock arrives; a sustained Strait of Hormuz disruption that pushes oil meaningfully higher and reignites CPI pressure.
For instance, it would test whether the current implied volatility surface is adequately pricing tail risk. For now, the data supports the Iran fatigue thesis. Whether it persists depends on the novelty of the next headline, not its geography.
Disclaimer: Coinspeaker is committed to providing unbiased and transparent reporting. This article aims to deliver accurate and timely information but should not be taken as financial or investment advice. Since market conditions can change rapidly, we encourage you to verify information on your own and consult with a professional before making any decisions based on this content.
Daniel Frances is a technical writer and Web3 educator specializing in macroeconomics and DeFi mechanics. A crypto native since 2017, Daniel leverages his background in on-chain analytics to author evidence-based reports and deep-dive guides. He holds certifications from The Blockchain Council, and is dedicated to providing "information gain" that cuts through market hype to find real-world blockchain utility.