ADA is consolidating, yet analysts foresee a strong long-term rally.
Gambardello projects a $10 ADA by 2025.
eToro has relisted ADA in the U.S., reviving interest after its 2021 delisting.
Cardano ADA$0.2624h volatility:3.4%Market cap:$9.52 BVol. 24h:$429.60 M
is currently trading at $0.751, showing no notable movement over the last 24 hours. While the price remains stagnant in the short term, analysts express strong confidence in ADA’s long-term potential.
Crypto analyst Dan Gambardello recently noted Cardano’s tendency to undergo extended consolidation phases before experiencing sharp rallies. According to him, the current 176-day consolidation closely mirrors ADA’s historical average of 179 days prior to breakouts.
CARDANO: “These Are the Ingredients for $10 ADA!”
Intro 00:00 How to win in crypto 1:00 The ingredients for $10 $ADA 2:00 Bitcoin and Cardano news 5:00 Frustrations 6:00 Cardano price weekly 6:40 How long until breakout 8:30 Short term price dip or breakout 12:30 pic.twitter.com/XIMXIkAhFL
Gambardello suggests that Cardano is now in a “pre-bull market” phase, setting the stage for a major uptrend. He predicts ADA could hit $10 by 2025, citing the upcoming Midnight airdrop, which targets over 37 million users, and speculation around a future Cardano ETF.
Meanwhile, on-chain data reveals that large investors have purchased over 180 million ADA, worth around $135 million, in just the past week.
This spike in accumulation also follows eToro’s May 28 announcement that it is relisting ADA on its U.S. platform. ADA was previously delisted in 2021.
Ada price outlook
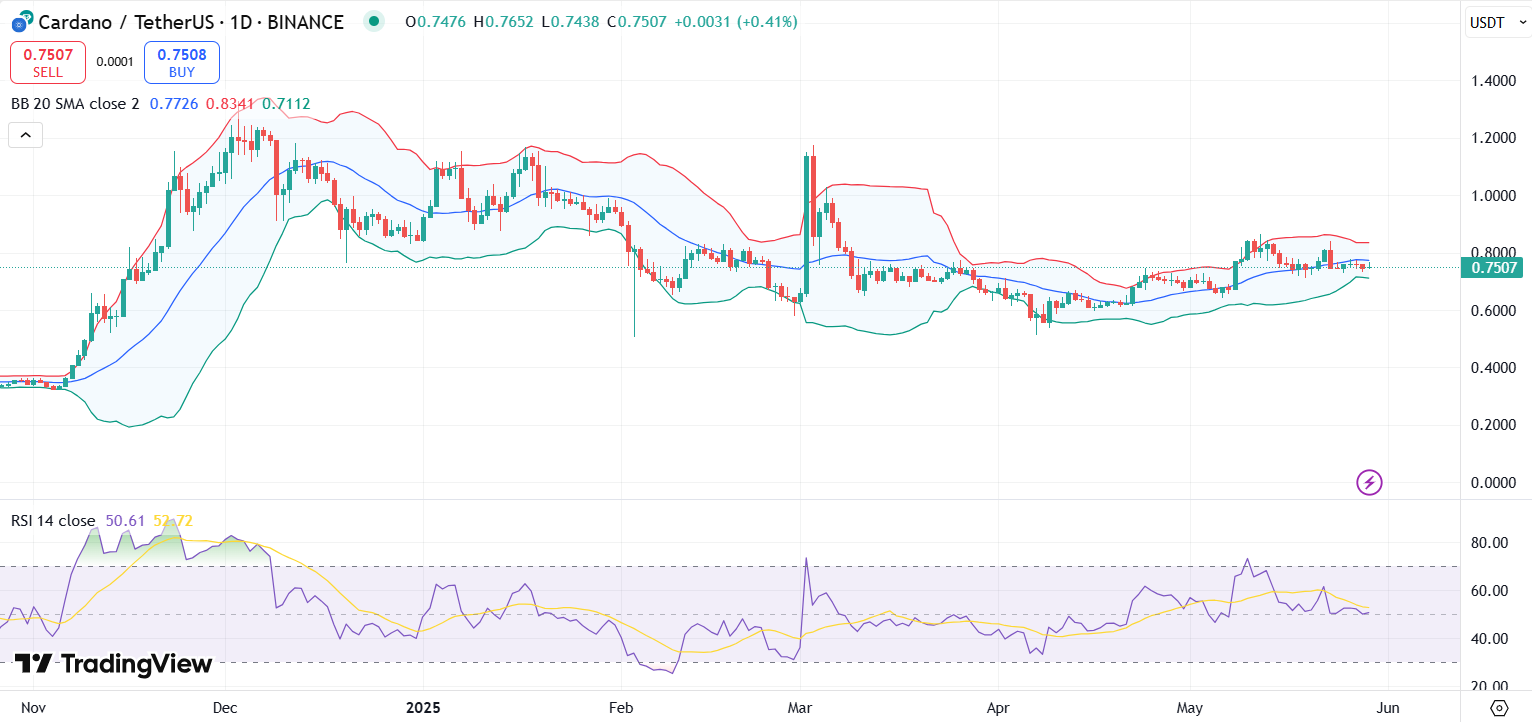
On the daily chart, ADA’s price is moving sideways between the lower and upper Bollinger Bands ($0.71 to $0.83). The bands are currently tightening, indicating a potential breakout in either direction.
ADA price chart with RSI and Bollinger Bands | Source: Trading View
A decisive break above the upper Bollinger Band at $0.83 could trigger a short-term rally.
The Relative Strength Index (RSI) is sitting around the neutral zone with no clear overbought or oversold conditions. This supports the ongoing consolidation but also suggests room for upward movement if bullish momentum picks up.
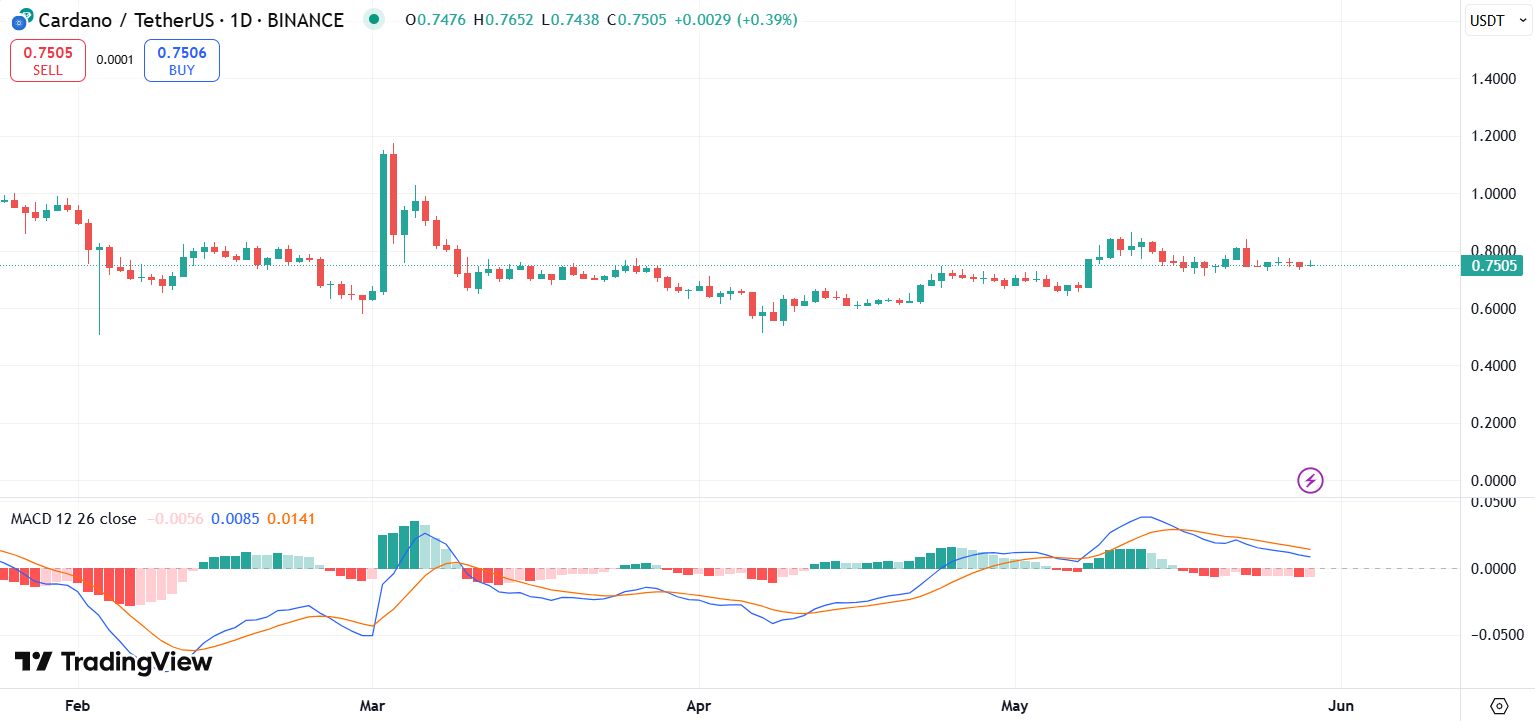
Meanwhile, the MACD indicator shows a bearish trend, with the signal line slightly above the MACD line. However, the converging lines with flattening red histogram suggests a possible bullish crossover if volume supports.
Disclaimer: Coinspeaker is committed to providing unbiased and transparent reporting. This article aims to deliver accurate and timely information but should not be taken as financial or investment advice. Since market conditions can change rapidly, we encourage you to verify information on your own and consult with a professional before making any decisions based on this content.
A crypto journalist with over 5 years of experience in the industry, Parth has worked with major media outlets in the crypto and finance world, gathering experience and expertise in the space after surviving bear and bull markets over the years. Parth is also an author of 4 self-published books.