In a recent post on X (formerly Twitter), the creator of the Stock-to-Flow (S2F) model noted that the Relative Strength Index (RSI) is nearing 75, a level historically followed by multiple months of even higher RSI readings in previous bull markets.
Bitcoin Relative Strength Index (RSI) is almost 75 (orange dot). In this bull market we will see several months with RSI 80+ (red dots, like 2021, 2017, 2013 and 2011) IMO. pic.twitter.com/2vprYLtFtV
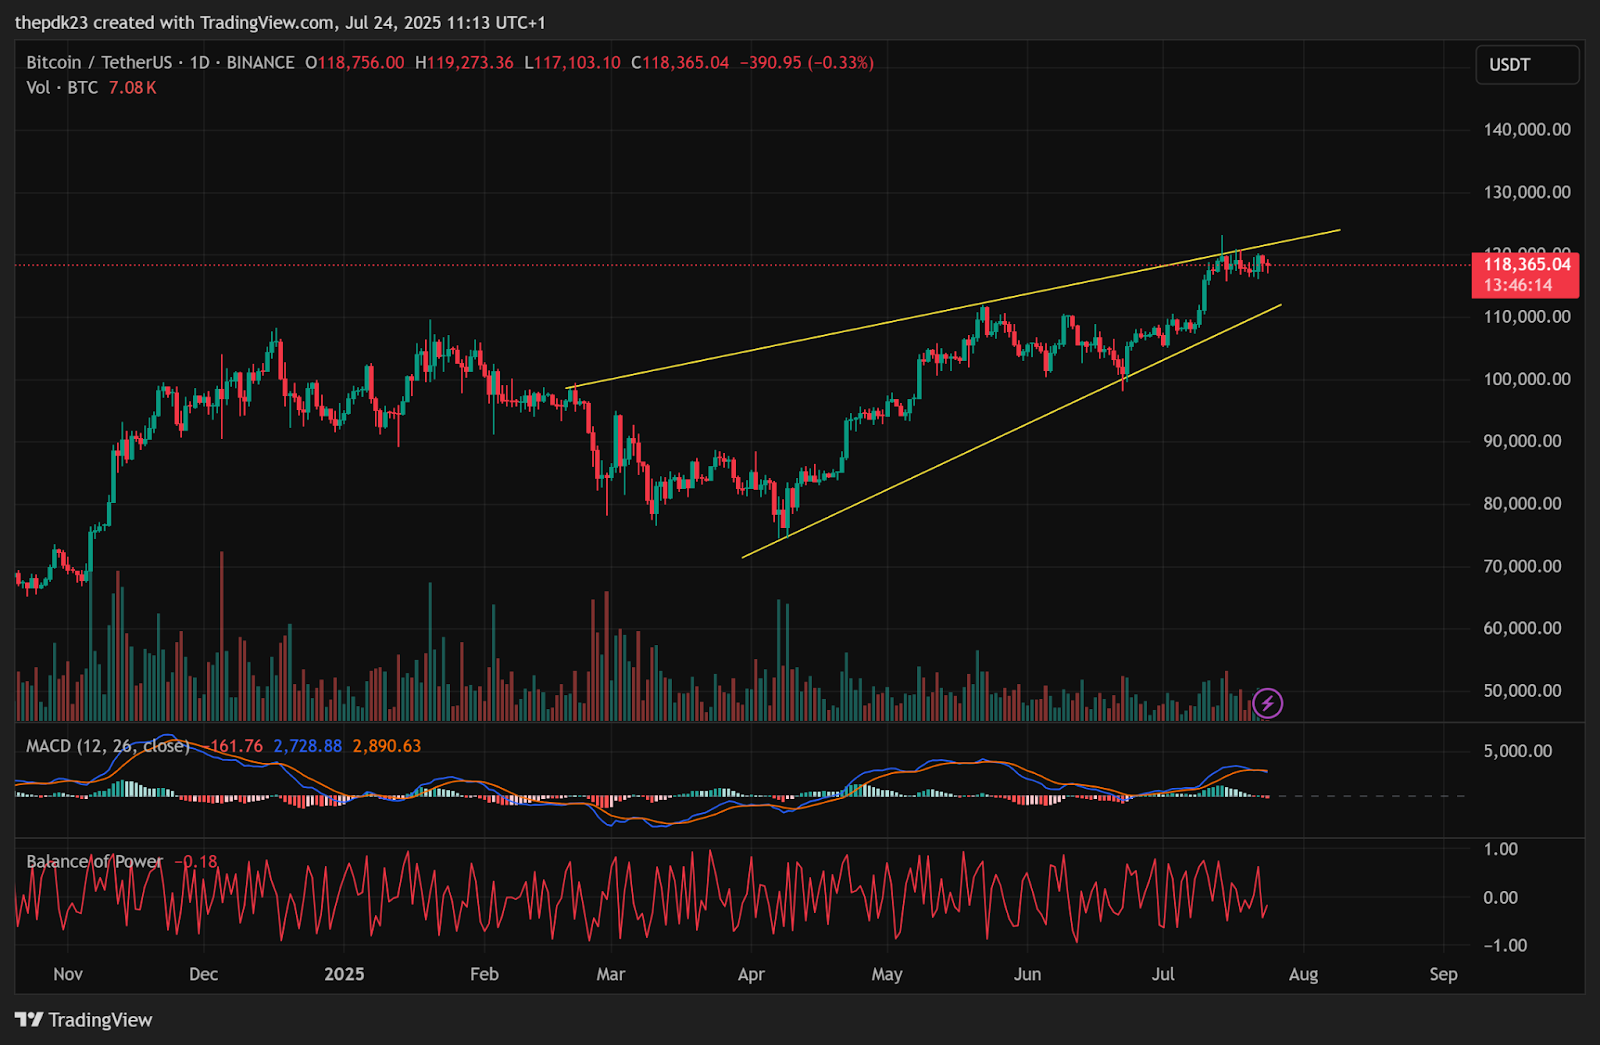
With BTC now trading at $118,365 and a market capitalization of $2.3 trillion, many market participants believe that further upside, despite volatility, is likely.
Liquidity Clusters Hint at Short Squeeze
Bitcoin briefly dipped to $117,000 on Thursday before bouncing back amid rising anticipation of a short squeeze but remains the top coins to buy.
Data from CoinGlass shows a build-up of overhead liquidity above spot price, a pattern known to act as a “magnet,” often triggering sharp upward moves. Trader Mister Crypto predicted a massive short squeeze.
Analyst Crypto Rover called the squeeze “obvious.” Meanwhile, fellow analyst Daan Crypto Trades identified $120,000 and $115,000 as key areas to watch, citing heavy positioning on both sides of the market.
$BTC Still stuck within this range. Lots of positions on both sides now.
According to Arab Chain, the Bitcoin Bull and Bear Market Cycle Indicator shows that the market is in a bullish zone but is fast approaching an “overheated” territory. Such a zone has signaled strong gains, often followed by corrections.
“This is not the right time for a major purchase,” Arab Chain noted, suggesting that investors are likely to wait for a pullback rather than buy into strength.
Meanwhile, the broader moving average trend, spanning 30 to 365 days, continues to support an upward trajectory unless disrupted by unexpected macro events.
Bitcoin Price Analysis: Rising Wedge Breakout
The Bitcoin daily chart reveals a classic rising wedge pattern, often a bearish reversal setup when formed after a prolonged uptrend. Price is now nearing the wedge’s apex, with immediate resistance near $123,000 and rising support around $110,000.
The MACD histogram is weakening, and the MACD line is starting to flatten, suggesting waning bullish momentum. A bearish crossover could trigger a retest of wedge support, possibly toward the $110,000–$112,000 region.
Bitcoin Daily Chart with Rising Wedge | Source: TradingView
The BoP indicator remains volatile, hovering around negative territory. A breakout above $123,000 could push BTC to new highs near $130,000–$135,000, with the RSI moving firmly into the 80+ range, in line with PlanB’s prediction.
However, a breakdown below $115,000 could lead to a sharper correction toward $105,000 or even $100,000.
Disclaimer: Coinspeaker is committed to providing unbiased and transparent reporting. This article aims to deliver accurate and timely information but should not be taken as financial or investment advice. Since market conditions can change rapidly, we encourage you to verify information on your own and consult with a professional before making any decisions based on this content.
A crypto journalist with over 5 years of experience in the industry, Parth has worked with major media outlets in the crypto and finance world, gathering experience and expertise in the space after surviving bear and bull markets over the years. Parth is also an author of 4 self-published books.