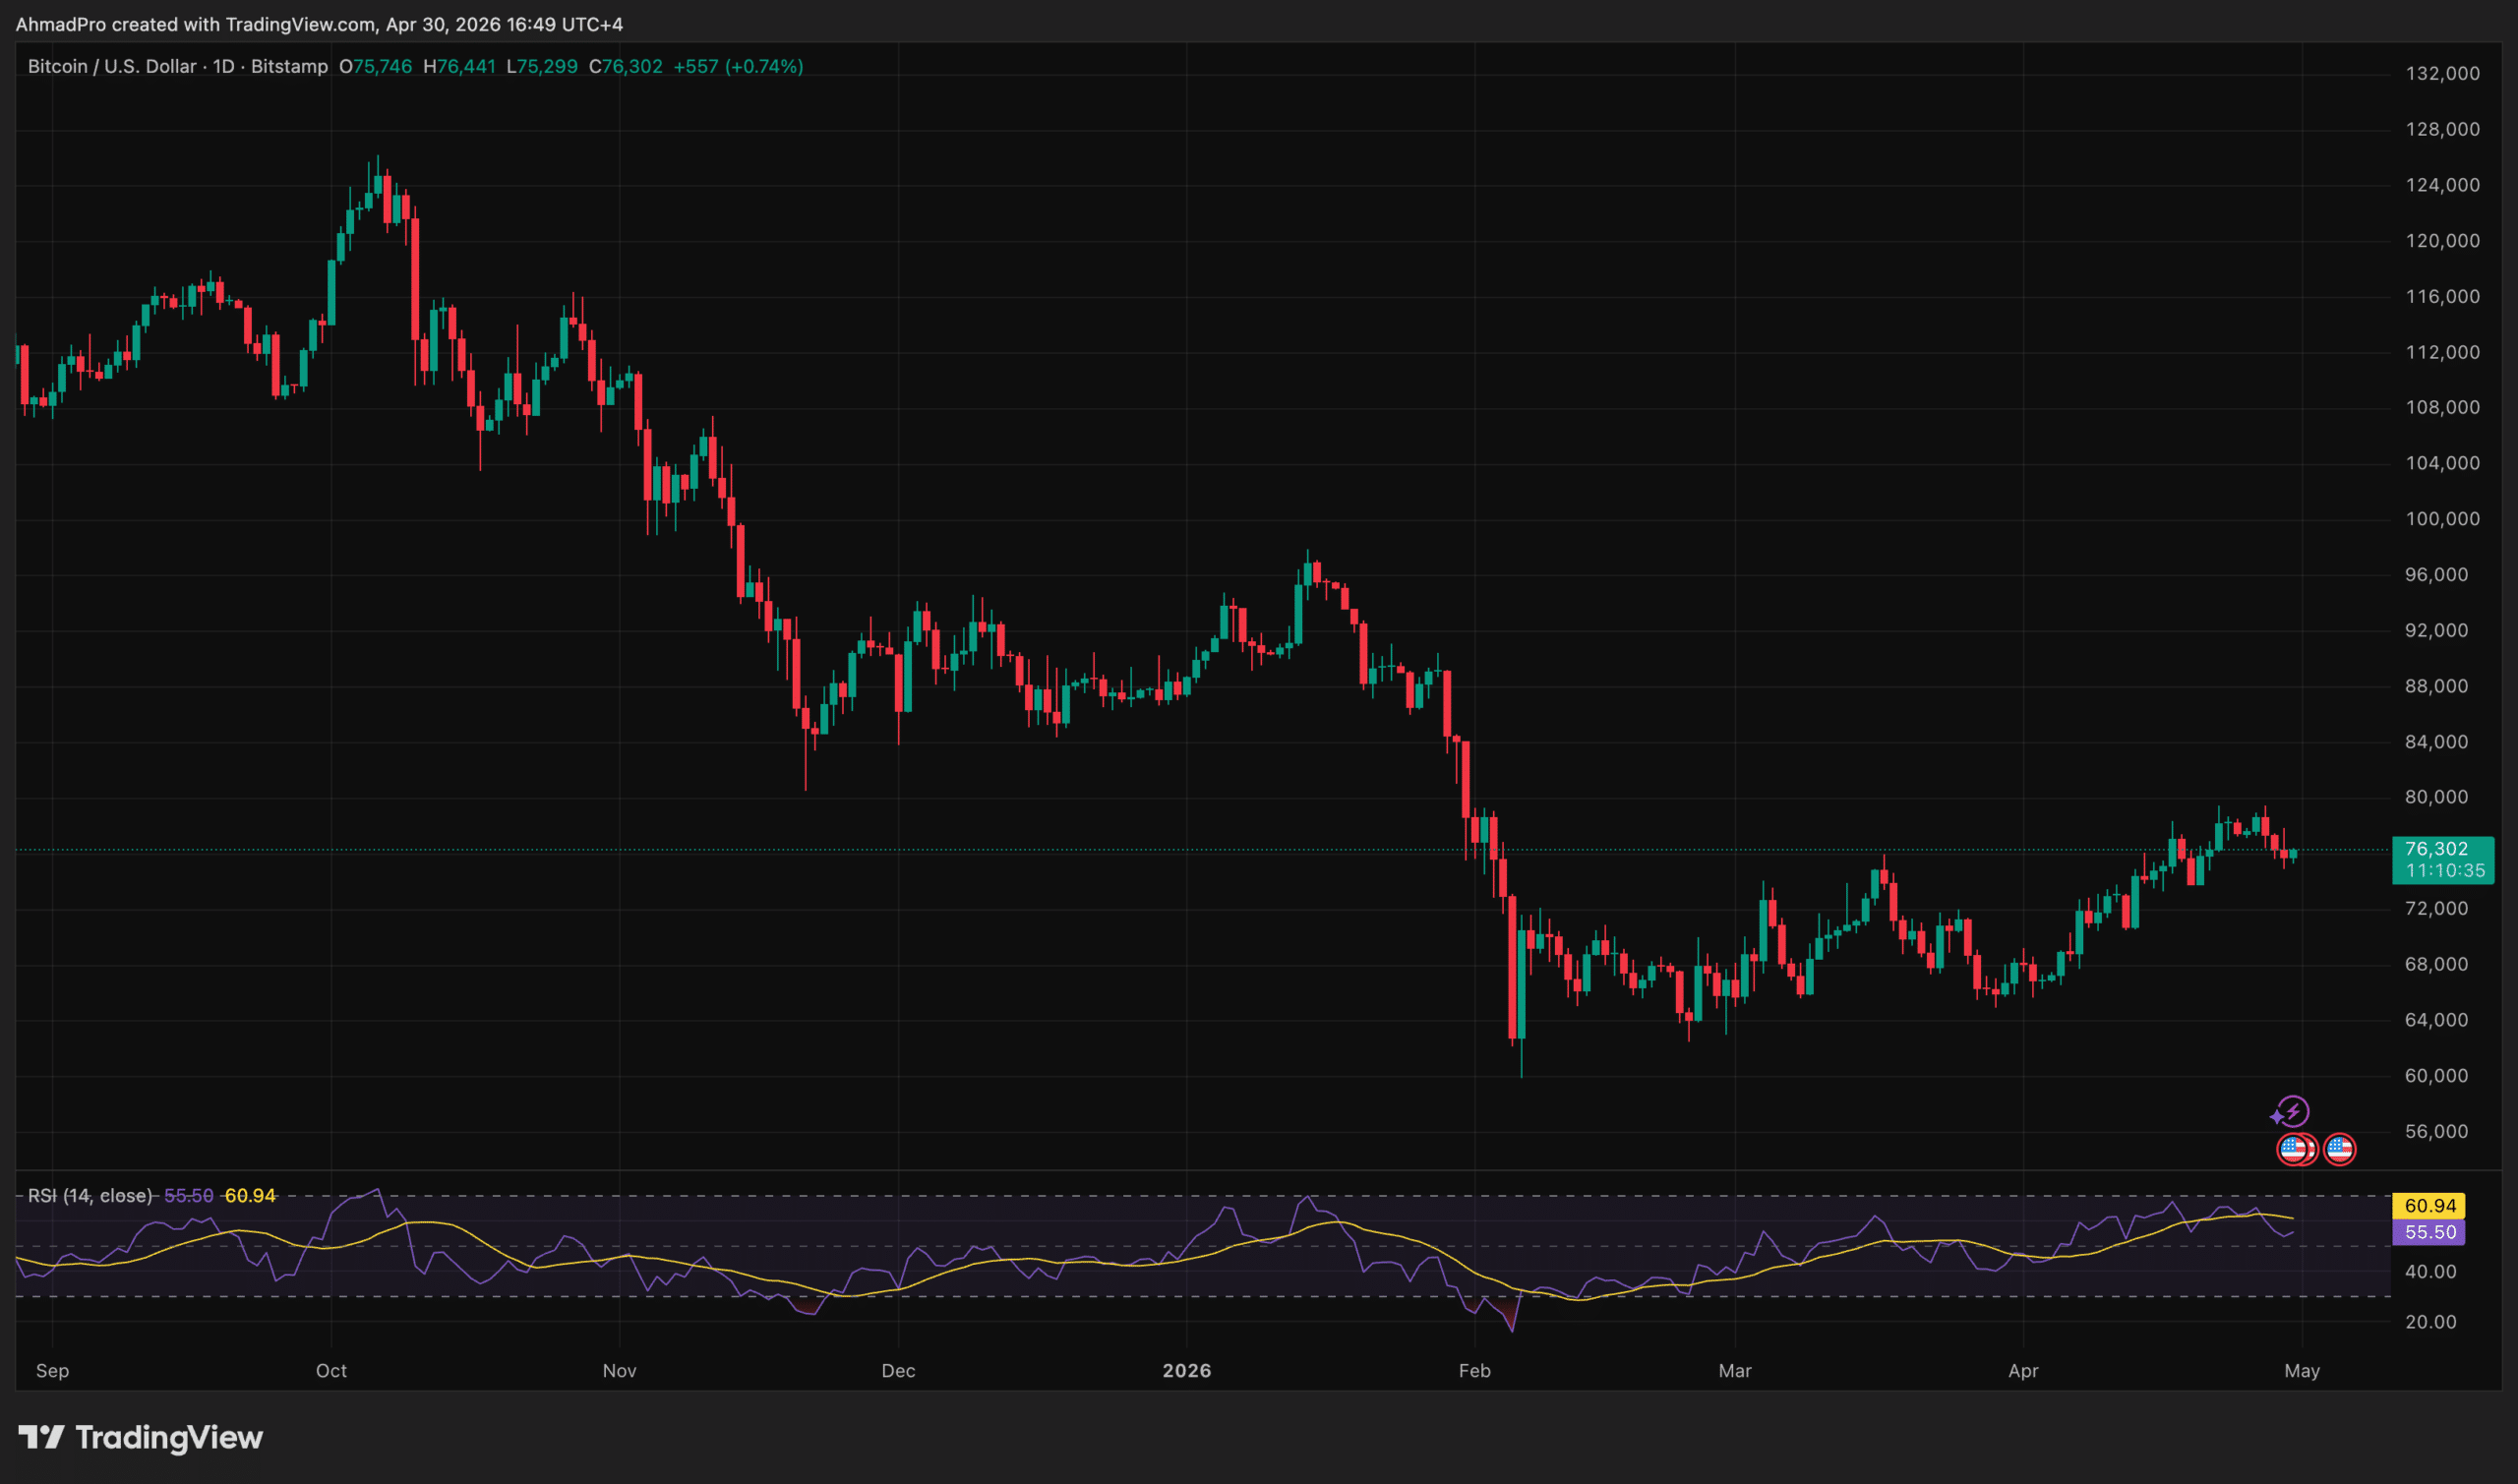
In Bitcoin news today, the Federal Reserve held the federal funds rate at 3.5%–3.75% on Wednesday in what was almost certainly Jerome Powell’s final meeting as chair, with an 8-4 FOMC vote revealing a committee more fractured than the headline hold implies.
Bitcoin traded near $76,000 by late Wednesday in New York, down from $77,000 earlier in the session, extending a roughly 40% drawdown from October 2025’s all-time high near $126,000.
The analytical question is no longer whether the pause delays the bull case by a quarter. It is whether the three simultaneous tailwinds that were supposed to power the $250,000 bitcoin price prediction, monetary easing, crypto regulation clarity, and AI-sector momentum, have stalled long enough to render the thesis structurally inoperative for this cycle.
JUST IN: THE FED LEFT INTEREST RATES UNCHANGED AT 3.50% TO 3.75%, BUT THE VOTE WAS THE MOST DIVIDED FOMC DECISION SINCE OCTOBER 1992 🇺🇸
The vote: 8-4 in favor of holding rates.
The dissents went in opposite directions: – Miran dissented in favor of a 0.25% rate cut – Hammack,… pic.twitter.com/shAPgoNFUf
Bitcoin News Today: The Fed Pause, Inflation Arithmetic, and the Liquidity Transmission Channel
The mechanism transmitting the FOMC decision into Bitcoin’s price trajectory operates as follows: a rate hold in an environment of sticky inflation compresses risk appetite by sustaining real opportunity cost across dollar-denominated assets, withdrawing the incremental liquidity that speculative positions in high-beta assets require to attract marginal capital.
The 2022 episode established the empirical template, a 65% collapse in Bitcoin’s price unfolded in direct correspondence with the Federal Reserve’s most aggressive tightening cycle in four decades, as duration-sensitive risk assets repriced simultaneously.
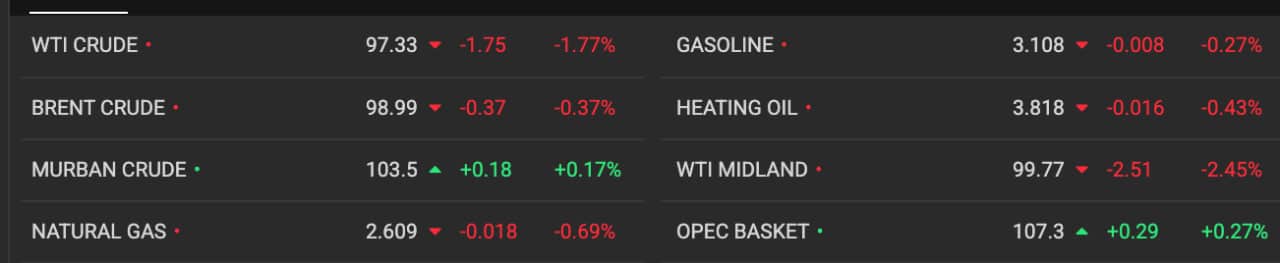
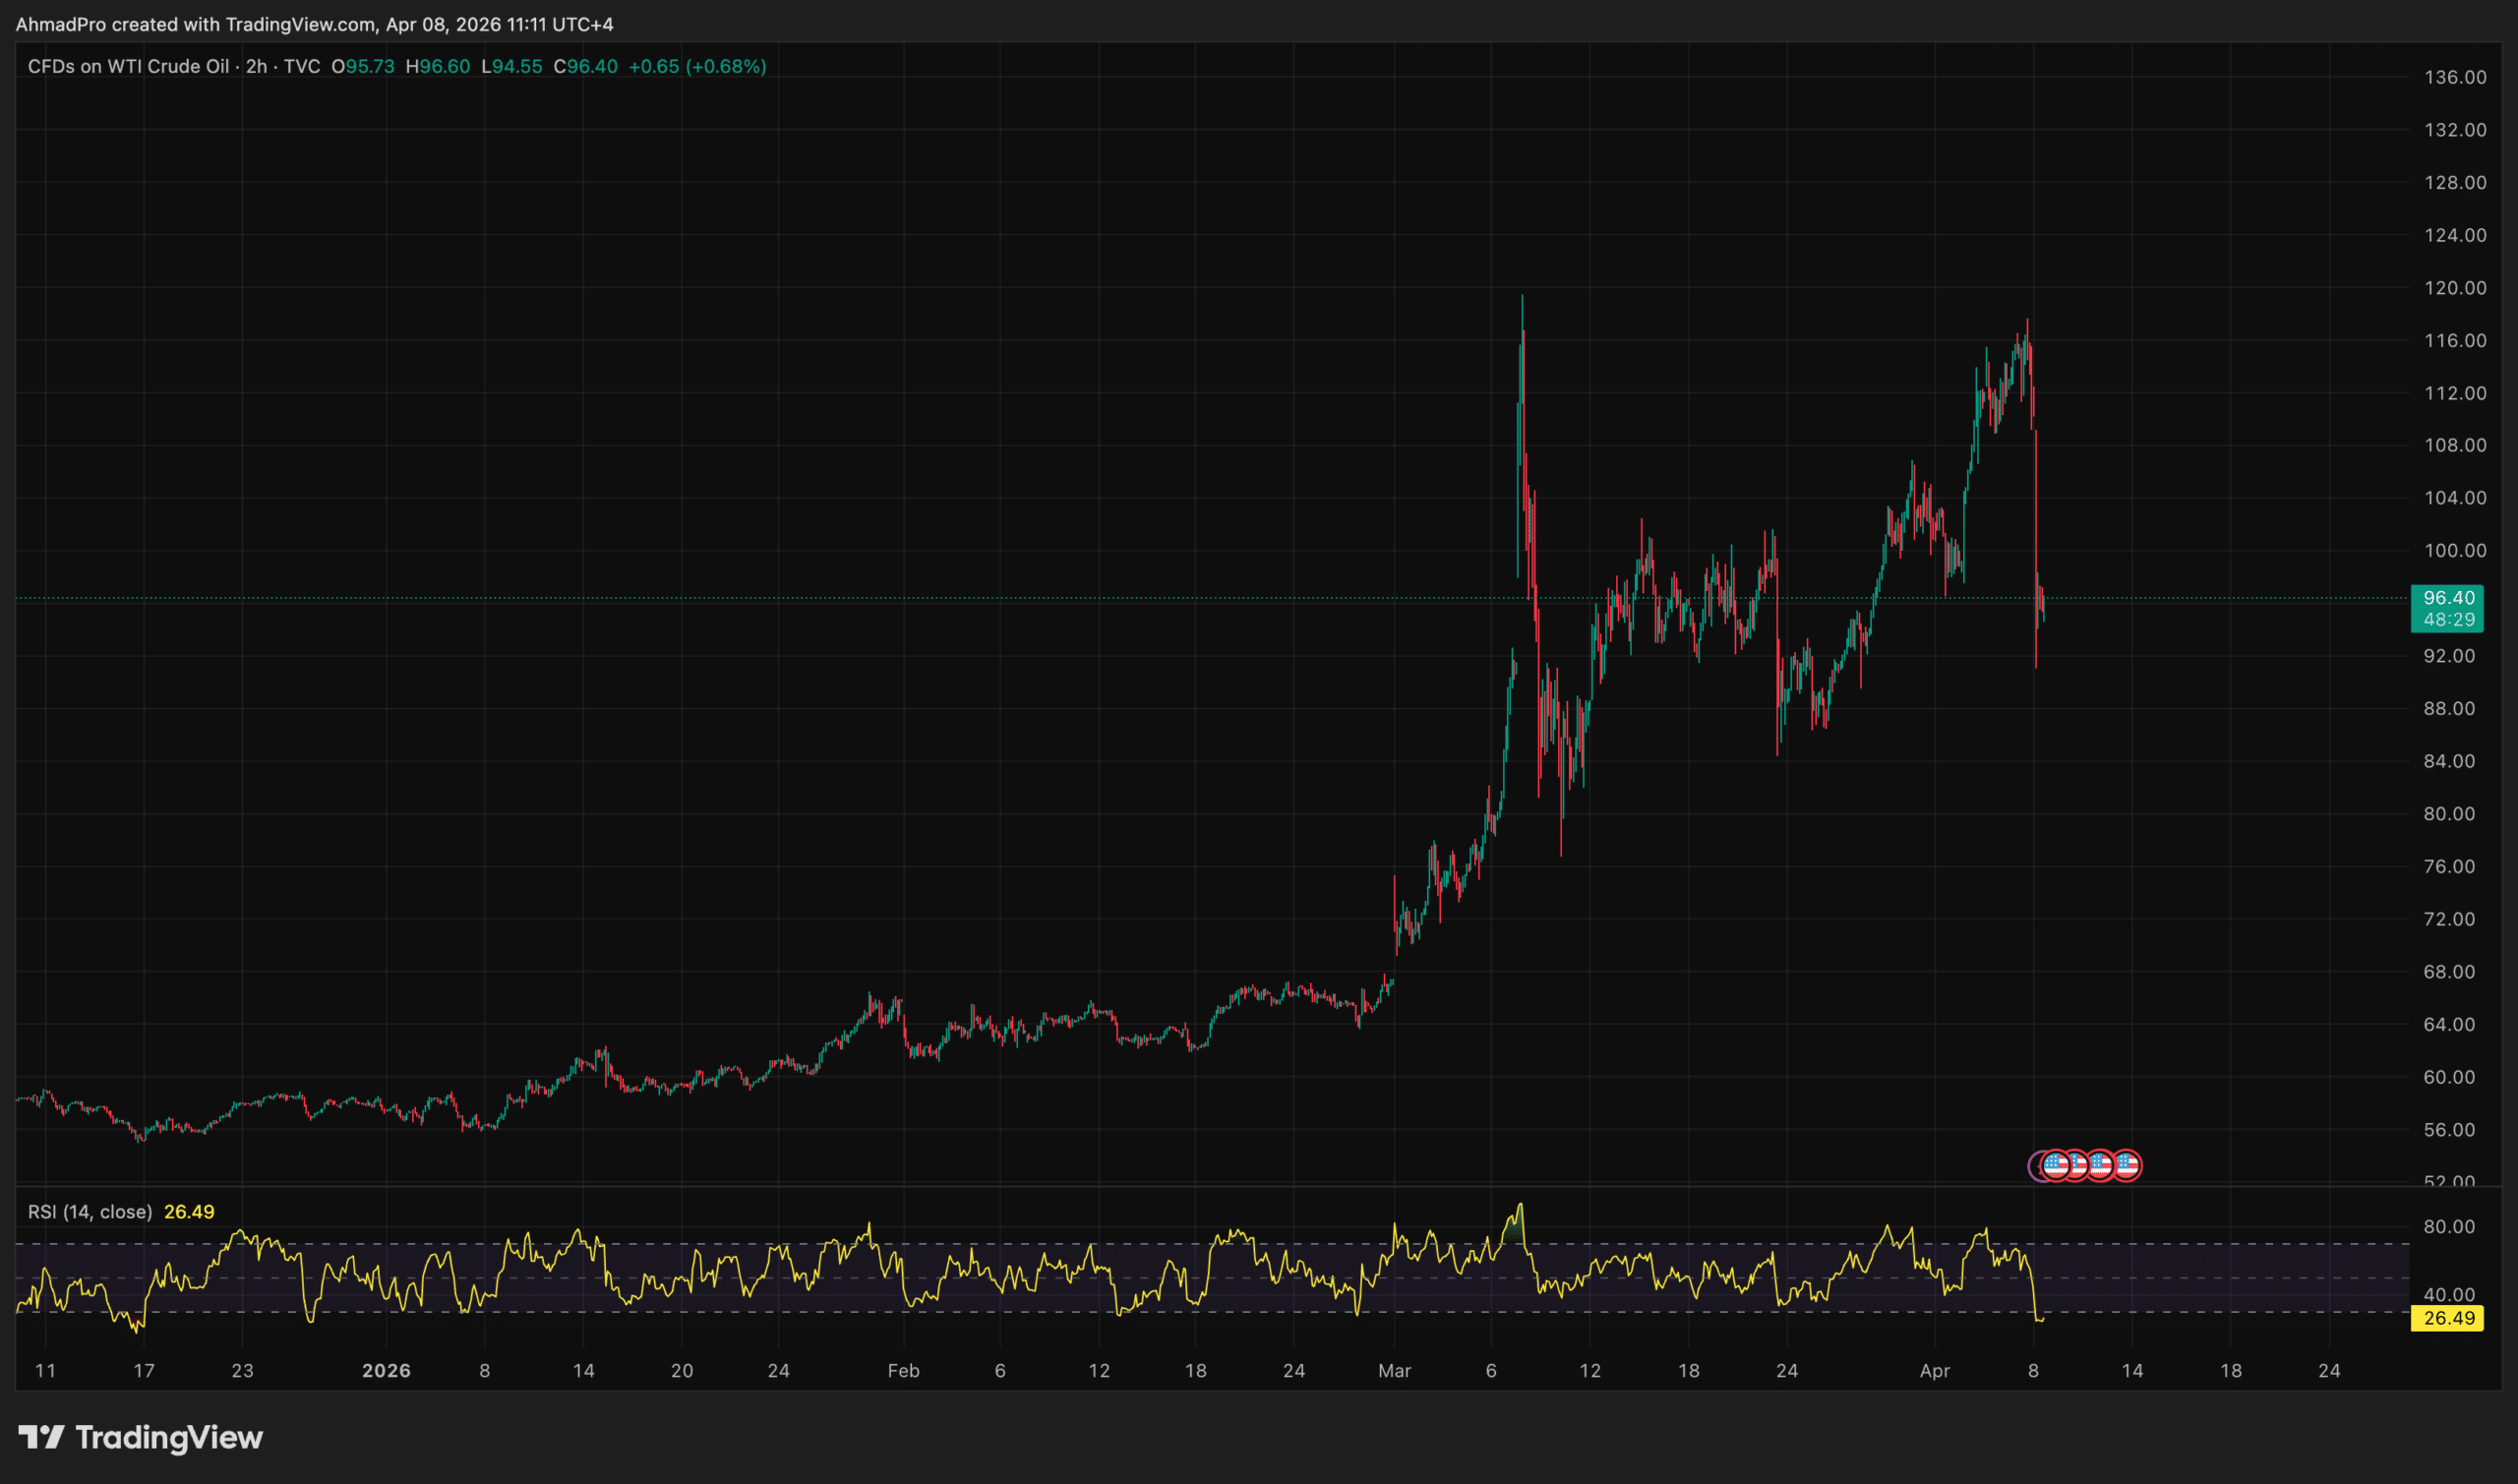
Wednesday’s hold was not tightening, but it was not the easing the $250,000 thesis priced in. The committee cited “developments in the Middle East” as a material source of uncertainty, coded language for an oil supply shock that is doing exactly what oil supply shocks do to central bank optionality.
Brent crude has been pinned above $110 a barrel for most of April, with the Strait of Hormuz – through which roughly 20% of seaborne oil flows, continuing to disrupt shipping. The US national average gas price reached $4.22 a gallon this week, up 6.2% in a month.
Jerry Tempelman, a former senior analyst at the New York Fed and now vice president of economic and fixed-income research at Mutual of America Capital Management, characterized the disruption as something that “could result in prolonged pricing stress that trickles through the market,” concluding that a 2026 cut looks unlikely absent a severe energy or labor-market shock.
CME FedWatch data corroborates that judgment, with traders pricing rates on hold through December. The FOMC dissent structure is informative but not yet decisive: Governor Stephen Miran pushed for an immediate cut while three others dissented against easing language, producing a vote that signals genuine disagreement rather than a committee moving coherently in either direction. That ambiguity is itself a headwind – markets price certainty, not internal debate.
Disclaimer: Coinspeaker is committed to providing unbiased and transparent reporting. This article aims to deliver accurate and timely information but should not be taken as financial or investment advice. Since market conditions can change rapidly, we encourage you to verify information on your own and consult with a professional before making any decisions based on this content.
Daniel Frances is a technical writer and Web3 educator specializing in macroeconomics and DeFi mechanics. A crypto native since 2017, Daniel leverages his background in on-chain analytics to author evidence-based reports and deep-dive guides. He holds certifications from The Blockchain Council, and is dedicated to providing "information gain" that cuts through market hype to find real-world blockchain utility.
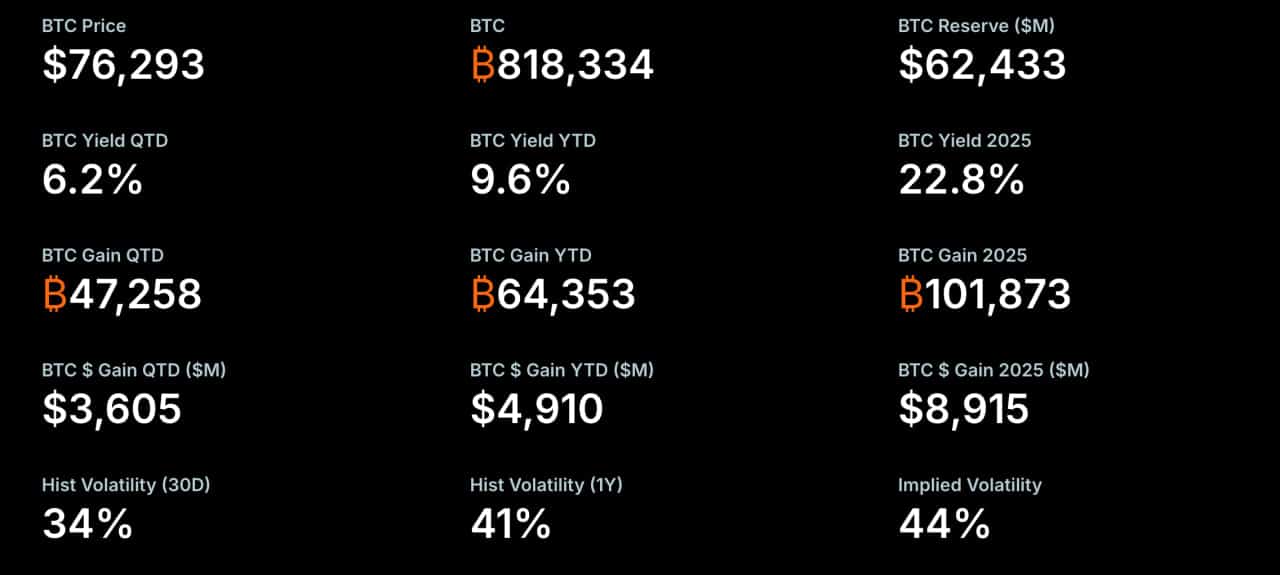
Strategy purchased approximately 3,376 Bitcoin for roughly $255 million on April 27, 2026, funded through the sale of approximately 1.45 million common shares via its at-the-market equity offering program, according to an SEC filing submitted that date. The acquisition brings the firm’s cumulative holdings to 818,334 BTC – acquired for a total of $61.81 billion at an average cost of $75,537 per coin.
That figure represents approximately 3.9% of Bitcoin’s fixed 21 million supply. Each weekly purchase removes additional coins from active float at a moment when spot ETF demand and corporate treasury accumulation are compressing the liquid market simultaneously.
Strategy has acquired 3,273 BTC for ~$255.0 million at ~$77,906 per bitcoin and has achieved BTC Yield of 9.6% YTD 2026. As of 4/26/2026, we hodl 818,334 $BTC acquired for ~$61.81 billion at ~$75,537 per bitcoin. $MSTR$STRChttps://t.co/HnXQ1OY6Yv
ATM Equity Program Funds the Buy: How Strategy Bitcoin Accumulation Mechanism Operates
The mechanism functions as follows: Strategy sells newly issued common shares into the open market through its registered at-the-market program, converts the proceeds into Bitcoin, and holds the coins on its balance sheet indefinitely. The April 27 purchase diverges from recent transactions that drew on proceeds from STRC, the firm’s variable-rate preferred stock offering – this buy was financed entirely through common equity dilution.
The prior week’s acquisition – 34,164 BTC at $74,395 per coin, totaling more than $2.5 billion – leaned more heavily on the STRC instrument. As previously reported, Strategy has structured multiple capital channels precisely to maintain accumulation velocity regardless of which funding window is most favorable at a given moment. April 2026 purchases alone have exceeded $6.4 billion in aggregate.
Source: Strategy
Strategy’s BTC Yield – a proprietary metric measuring Bitcoin per diluted share growth – reached 9.6% year-to-date through the April 27 filing, up from 9.5% in the prior disclosure. The number is not a return in the traditional sense; it measures how quickly the per-share Bitcoin exposure is expanding as the firm continues issuing equity to fund purchases. The coins are not being sold.
818,334 BTC and Shrinking Float: What Sustained Corporate Accumulation Does to Market Structure
Strategy’s holdings now exceed the combined Bitcoin treasury positions of every other publicly traded company by a margin that makes direct comparison difficult. GameStop, for instance, confirmed a 4,710 BTC position as of January 31, 2026 – a treasury commitment that underscores the broadening corporate adoption trend while remaining a fraction of Strategy’s scale.
The structural implication of Strategy’s accumulation rate is straightforward: at current Bitcoin mining issuance of roughly 450 BTC per day post-halving, a single $255 million weekly purchase absorbs more than a week’s worth of new supply. When combined with spot ETF inflows, the programmatic bid from corporate treasuries is pulling supply out of circulation faster than new coins enter it.
Executive chairman Michael Saylor posted a preview of the purchase on April 26 via X – his “Orange Dots” accumulation chart captioned “The ₿eat Goes On” – hours before the SEC filing confirmed the transaction. Saylor reached 5 million followers on the platform the same day the disclosure landed. Critics, including gold advocate Peter Schiff, continue to characterize the debt-and-equity-funded accumulation model as structurally unsustainable. Strategy’s balance sheet has not yet provided evidence that the argument is gaining traction among its capital providers.
Disclaimer: Coinspeaker is committed to providing unbiased and transparent reporting. This article aims to deliver accurate and timely information but should not be taken as financial or investment advice. Since market conditions can change rapidly, we encourage you to verify information on your own and consult with a professional before making any decisions based on this content.
Daniel Frances is a technical writer and Web3 educator specializing in macroeconomics and DeFi mechanics. A crypto native since 2017, Daniel leverages his background in on-chain analytics to author evidence-based reports and deep-dive guides. He holds certifications from The Blockchain Council, and is dedicated to providing "information gain" that cuts through market hype to find real-world blockchain utility.
Bitcoin price traded at $77,541 on Wednesday morning, up +2.2% over 24 hours and +4.3% on the week, after President Trump announced an indefinite extension of the Iran ceasefire and Strategy disclosed a $2.54 billion BTC acquisition – its largest single purchase in 17 months. The two catalysts arrived in close sequence, compressing what had been 46 days of funding rate suppression into a sharp repricing across crypto markets and traditional equities alike.
Fox News reports on Iran and Israel ceasefire agreement.
The analytical question is no longer whether Bitcoin can sustain a move above $75,000; it is whether the current $77,500 print reflects durable demand or a mechanical relief trade that exhausts itself before the $80,000 threshold becomes testable. Those are structurally different outcomes, and the data available Wednesday morning does not yet settle the question cleanly.
Cross-Asset Transmission: Reduced Trump Hormuz Risk Flows Through Oil Into Risk Appetite like Bitcoin
The transmission mechanism here is specific. Trump’s ceasefire extension strategy – framed around what he described as a “seriously fractured” leadership structure in Tehran – removed the immediate probability of resumed strikes while preserving the US Strait of Hormuz blockade. That combination kept oil prices contained: Brent crude held near $90 a barrel rather than spiking toward the $105–$110 range that brief diplomatic breakdowns had threatened over the prior weekend.
Contained oil pricing reduces near-term inflation expectations, which in turn reduces the risk-off pressure that had been suppressing equity multiples and crypto positioning simultaneously. S&P 500 futures rose +0.5% and Nasdaq 100 futures gained +0.6% in the hours following the announcement, though both underlying benchmarks had closed lower Tuesday as talks briefly wobbled. The MSCI Asia Pacific Index slipped -0.7%, suggesting the transmission was uneven across regions – investors in Asia remain more cautious about how long the Hormuz disruption persists regardless of ceasefire terms.
Within crypto, beside Bitcoin, Ether rose +2.1% to $2,366, BNB climbed +1.3% to $640, and Solana gained +1.8% to $87 post Trump announcement. The breadth of the move across majors is consistent with a genuine risk-on rotation rather than a Bitcoin-specific catalyst. The only red in the top 10 was a marginal -0.1% drift in stablecoins and Tron, which typically underperform in risk-on sessions as capital rotates toward higher-beta assets. Trump’s broader posture as a pro-crypto political figure adds a secondary transmission layer – the administration’s comfort with digital assets reduces regulatory risk premium alongside the geopolitical premium, amplifying the net effect on crypto price.
Bitcoin After Ceasefire: The $77,500 Print and the $80,000 Resistance Overhead
Bitcoin’s current structure positions $75,000 as the immediate support floor and $80,000 as the first confirmed resistance level of consequence. The 46-day funding rate compression that preceded Wednesday’s move is significant: extended periods of suppressed funding typically accumulate short positioning that, when unwound, can accelerate price through resistance levels faster than organic demand alone would support. Whether that dynamic is fully in play depends on whether open interest rebuilds above $77,500 in the hours following the initial spike.
On the downside, analyst Darkfost has identified the realized price of short-term Bitcoin holders at approximately $69,400 – the level at which recent buyers move from unrealized losses into profit. Bitcoin holding above this level materially reduces the probability of a cascade liquidation if sentiment reverses, because holders sitting on gains are structurally less likely to become forced sellers. The gap between $69,400 and $75,000 provides a meaningful cushion that did not exist during the prior failed attempt at $78,000 ten weeks ago.
Three scenarios present themselves. Bull case: Bitcoin closes above $77,500 through the European session, open interest rebuilds as new longs enter rather than shorts cover, and a clean break above $80,000 confirms the funding rate compression has flipped into a sustained squeeze – with $85,000 as the next meaningful target.
Base case: Bitcoin consolidates between $75,000 and $78,000 as the ceasefire extension is priced in and the market waits for either a finalized US-Iran agreement or the next macro data catalyst, with longer-term technical patterns pointing toward a $90,000 target if the bull trend reasserts.
Bear case: Hormuz blockade news resurfaces, oil retests $105, and Bitcoin reverses below $75,000 – a move that would signal the extension was already fully priced at the open, and the rally requires a fresh catalyst to resume.
Disclaimer: Coinspeaker is committed to providing unbiased and transparent reporting. This article aims to deliver accurate and timely information but should not be taken as financial or investment advice. Since market conditions can change rapidly, we encourage you to verify information on your own and consult with a professional before making any decisions based on this content.
Daniel Frances is a technical writer and Web3 educator specializing in macroeconomics and DeFi mechanics. A crypto native since 2017, Daniel leverages his background in on-chain analytics to author evidence-based reports and deep-dive guides. He holds certifications from The Blockchain Council, and is dedicated to providing "information gain" that cuts through market hype to find real-world blockchain utility.
Henry Paulson, who served as Treasury Secretary from 2006 to 2009 and architected the $700Bn TARP stabilization during the 2008 financial crisis, warned on Bloomberg Television’s Wall Street Week that the US Treasury market faces the risk of a “vicious” crash, calling for a “break-the-glass” emergency contingency plan to be prepared for immediate deployment.
His proposed measures include closing tax loopholes, overhauling Social Security, and restructuring healthcare spending – a scope that signals Paulson views the fiscal trajectory as a structural problem, not a cyclical one. US national debt stood at approximately $38.9Bn as of mid-April 2026, with the debt-to-GDP ratio near 100% and the peacetime deficit running at a record 7% of GDP.
What I’m watching tonight:
“Panic: The Untold Story of the 2008 Financial Crisis”
HBO / Vice production
Third time watching it.
A FANTASTIC perspective into the inside baseball between the Secretary of Treasury (Henry Paulson), Federal Reserve Bank of NY President (Tim…
We suspect Paulson’s intervention carries a weight distinct from the steady stream of deficit warnings that have circulated since the post-COVID fiscal expansion. A figure of his institutional standing – with direct experience managing a systemic liquidity crisis – invoking emergency language in a public forum is a signal of a different category than analyst commentary.
For crypto markets specifically, the more consequential question is not whether Paulson’s forecast proves accurate, but whether his warning accelerates the repricing of sovereign credibility risk that has already begun to appear in yield curve dynamics – and which transmission channel carries that repricing into digital asset valuations.
Treasury Yield Stress, Dollar Credibility, and the Liquidity Transmission Channel
The mechanism functions as follows: when a sovereign borrower of the US government’s scale runs a 7% peacetime deficit against a 100% debt-to-GDP ratio, the marginal buyer of Treasuries begins demanding additional yield to compensate for duration risk and fiscal sustainability concerns.
That demand is independent of Federal Reserve policy. JPMorgan Chase CEO Jamie Dimon articulated the dynamic directly, warning that rising Treasury yields could force higher borrowing costs for the government and mortgage markets, regardless of Fed action, driven purely by investor demand for risk compensation in an environment of outsized issuance.
The transmission chain operates as follows: elevated auction supply without commensurate foreign or domestic demand pushes yields higher at the long end; higher long-end yields tighten real financial conditions across the economy; tighter real conditions reduce the present value of risk assets while simultaneously elevating the opportunity cost of holding non-yielding assets, Bitcoin foremost among them.
The 2022 episode remains the cleanest empirical reference: Fed rate hikes produced a 65% collapse in Bitcoin’s price as capital rotated out of risk assets and into suddenly competitive fixed income. A Treasury market stress event that drove yields higher through credibility erosion rather than Fed action would transmit through an identical channel, at potentially greater speed.
Photo: Henry Paulson
Paulson’s warning arrives alongside criticism from American Enterprise Institute analysts who have described current budget policy as “grossly irresponsible” and noted that bond markets are monitoring fiscal decisions with increasing vigilance. Treasury Secretary Scott Bessent has publicly dismissed such alarms, stating on CBS News in June 2025 that Dimon’s track record of failing to act on warnings undermines the credibility of the current concern. That disagreement between the sitting Treasury secretary and a former one, with senior bank leadership aligned with the latter, is itself a signal worth pricing.
Bitcoin, Safe-Haven Rotation, and the Real Yield Compression Trade
The crypto transmission from a Treasury stress event is not uniform – it depends critically on which regime dominates as stress escalates. Two competing channels operate here, and they do not point in the same direction at the same time.
In a rising-yield regime driven by orderly fiscal concern, the transmission is negative for Bitcoin. Higher real yields increase the opportunity cost of holding a non-yielding asset, institutional risk appetite contracts, and capital rotates toward fixed income as it did in 2022. Bitcoin’s correlation with gold has strengthened in recent macro cycles, but that correlation breaks down when real yields rise sharply – gold holds better than Bitcoin in those environments because its safe-haven bid is more established among traditional allocators.
In a credibility-crisis regime – where the concern shifts from fiscal sustainability to dollar debasement and Treasury market dysfunction – the transmission reverses. Historically, dollar weakness driven by sovereign credibility losses has produced a safe-haven bid for hard assets, and Bitcoin’s fixed supply schedule positions it alongside gold as a debasement hedge.
The bull case for crypto in a Paulson-scenario-realized world is precisely this channel: institutional capital, having lost confidence in the real return of long-duration Treasuries, rotates toward assets with no counterparty risk and no inflationary dilution mechanism.
Disclaimer: Coinspeaker is committed to providing unbiased and transparent reporting. This article aims to deliver accurate and timely information but should not be taken as financial or investment advice. Since market conditions can change rapidly, we encourage you to verify information on your own and consult with a professional before making any decisions based on this content.
Daniel Frances is a technical writer and Web3 educator specializing in macroeconomics and DeFi mechanics. A crypto native since 2017, Daniel leverages his background in on-chain analytics to author evidence-based reports and deep-dive guides. He holds certifications from The Blockchain Council, and is dedicated to providing "information gain" that cuts through market hype to find real-world blockchain utility.
Goldman Sachs Group Inc. filed for a Bitcoin ETF on April 14, 2026 – formally entering the issuer side of a market it had previously accessed only as a buyer, and doing so with a product architecture designed specifically for the income-oriented institutional investor, its competitors have largely left underserved.
The filing, submitted under Goldman Sachs ETF Trust as post-effective amendment No. 717 to Form N-1A, proposes the Goldman Sachs Bitcoin Premium Income ETF, an actively managed fund that will hold at least 80% of net assets in Bitcoin-exposed instruments and overlay those positions with call options sold on 40% to 100% of exposure to generate monthly premiums.
The fund will route Bitcoin exposure primarily through existing spot Bitcoin ETPs – principally BlackRock’s IBIT – via a Cayman Islands subsidiary, a structure that allows Goldman to sidestep U.S. commodity restrictions while tapping IBIT’s $55 billion liquidity base.
JUST IN: ⚡️ Goldman Sachs has filed a registration statement with the SEC for a new Bitcoin Premium Income ETF. pic.twitter.com/q7nF2T5dlf
Portfolio management falls to Goldman Sachs Asset Management’s Raj Garigipati and Oliver Bunn. If the SEC approves it within the standard 75-day window, the fund could launch in late June or early July 2026.
This is not Goldman’s first Bitcoin exposure. It is Goldman’s first attempt to monetize that exposure for clients at scale.
Goldman Sachs Bitcoin Premium Income ETF: Why the Covered-Call Structure Changes the Distribution Equation
Goldman’s entry into the Bitcoin ETF issuer space follows a deliberate accumulation phase. Beginning in late 2024, the firm built $1.57 billion in spot Bitcoin ETF holdings – $1.27 billion in BlackRock’s IBIT and $288 million in Fidelity’s FBTC – representing a 121% quarter-over-quarter increase at the time of disclosure.
By Q4 2025, that position had grown to approximately 13,741 Bitcoin worth $1.71 billion across spot ETFs, alongside $1 billion in Ethereum ETFs, $153 million in XRP ETFs, and $108 million in Solana ETFs per 13F filings. Goldman was learning the market before entering it as a manufacturer.
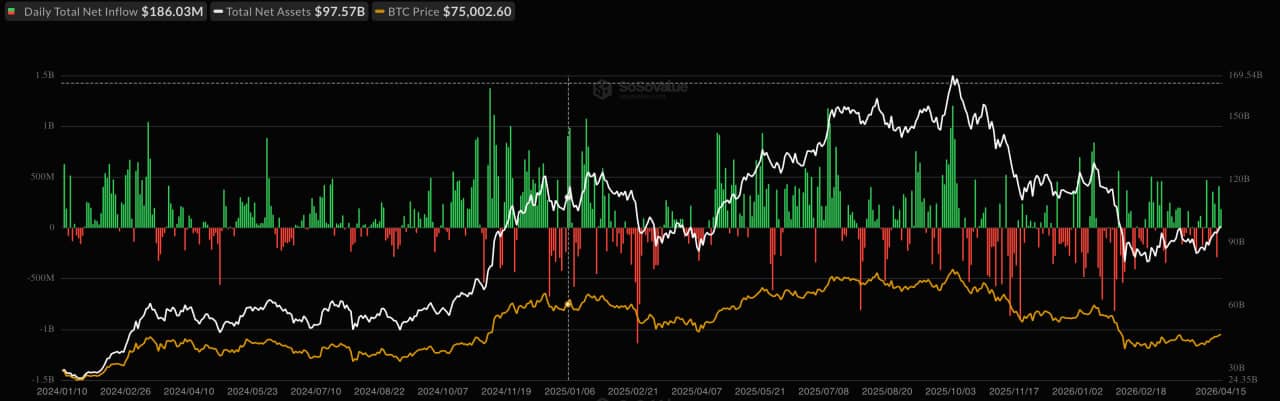
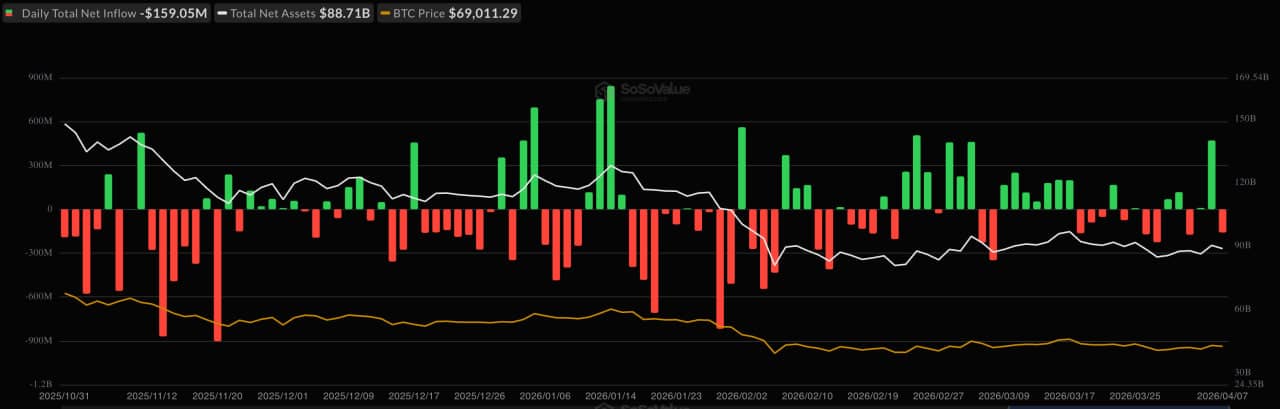
Total Bitcoin Spot ETF Net Inflow / Source: SoSoValue
The covered-call overlay is the mechanistic distinction that matters here. A standard spot Bitcoin ETF delivers full price exposure – gains and losses move in direct proportion to Bitcoin’s price. G
oldman’s product caps that upside during rallies by selling call options against the underlying position, collecting premiums that are then distributed to shareholders as monthly income. The trade-off is explicit: in a strong Bitcoin bull run, the fund will underperform a pure-exposure vehicle. In a sideways or modestly declining market, the premium income cushions returns in a way no spot ETF can replicate.
That framing targets a specific client segment – the wealth management client, the pension allocator, the conservative institutional buyer – for whom Bitcoin’s volatility has historically been the primary barrier to participation.
BlackRock’s comparable BITA ETF employs the same covered-call strategy atop IBIT’s liquidity base, but Goldman’s distribution network gives it a structurally different demand channel. As Arkham Research has described covered-call Bitcoin ETFs, the structure “transforms Bitcoin from a passive asset into an income-generating asset” by harvesting premiums in range-bound conditions – precisely the conditions that cause pure-exposure ETF holders to exit.
Goldman’s wirehouse scale is the variable its competitors cannot easily replicate. The firm’s institutional client base and advisor network represent a distribution pathway that directs capital differently than open-market retail demand – slower to enter, but considerably more durable once committed.
Disclaimer: Coinspeaker is committed to providing unbiased and transparent reporting. This article aims to deliver accurate and timely information but should not be taken as financial or investment advice. Since market conditions can change rapidly, we encourage you to verify information on your own and consult with a professional before making any decisions based on this content.
Daniel Frances is a technical writer and Web3 educator specializing in macroeconomics and DeFi mechanics. A crypto native since 2017, Daniel leverages his background in on-chain analytics to author evidence-based reports and deep-dive guides. He holds certifications from The Blockchain Council, and is dedicated to providing "information gain" that cuts through market hype to find real-world blockchain utility.
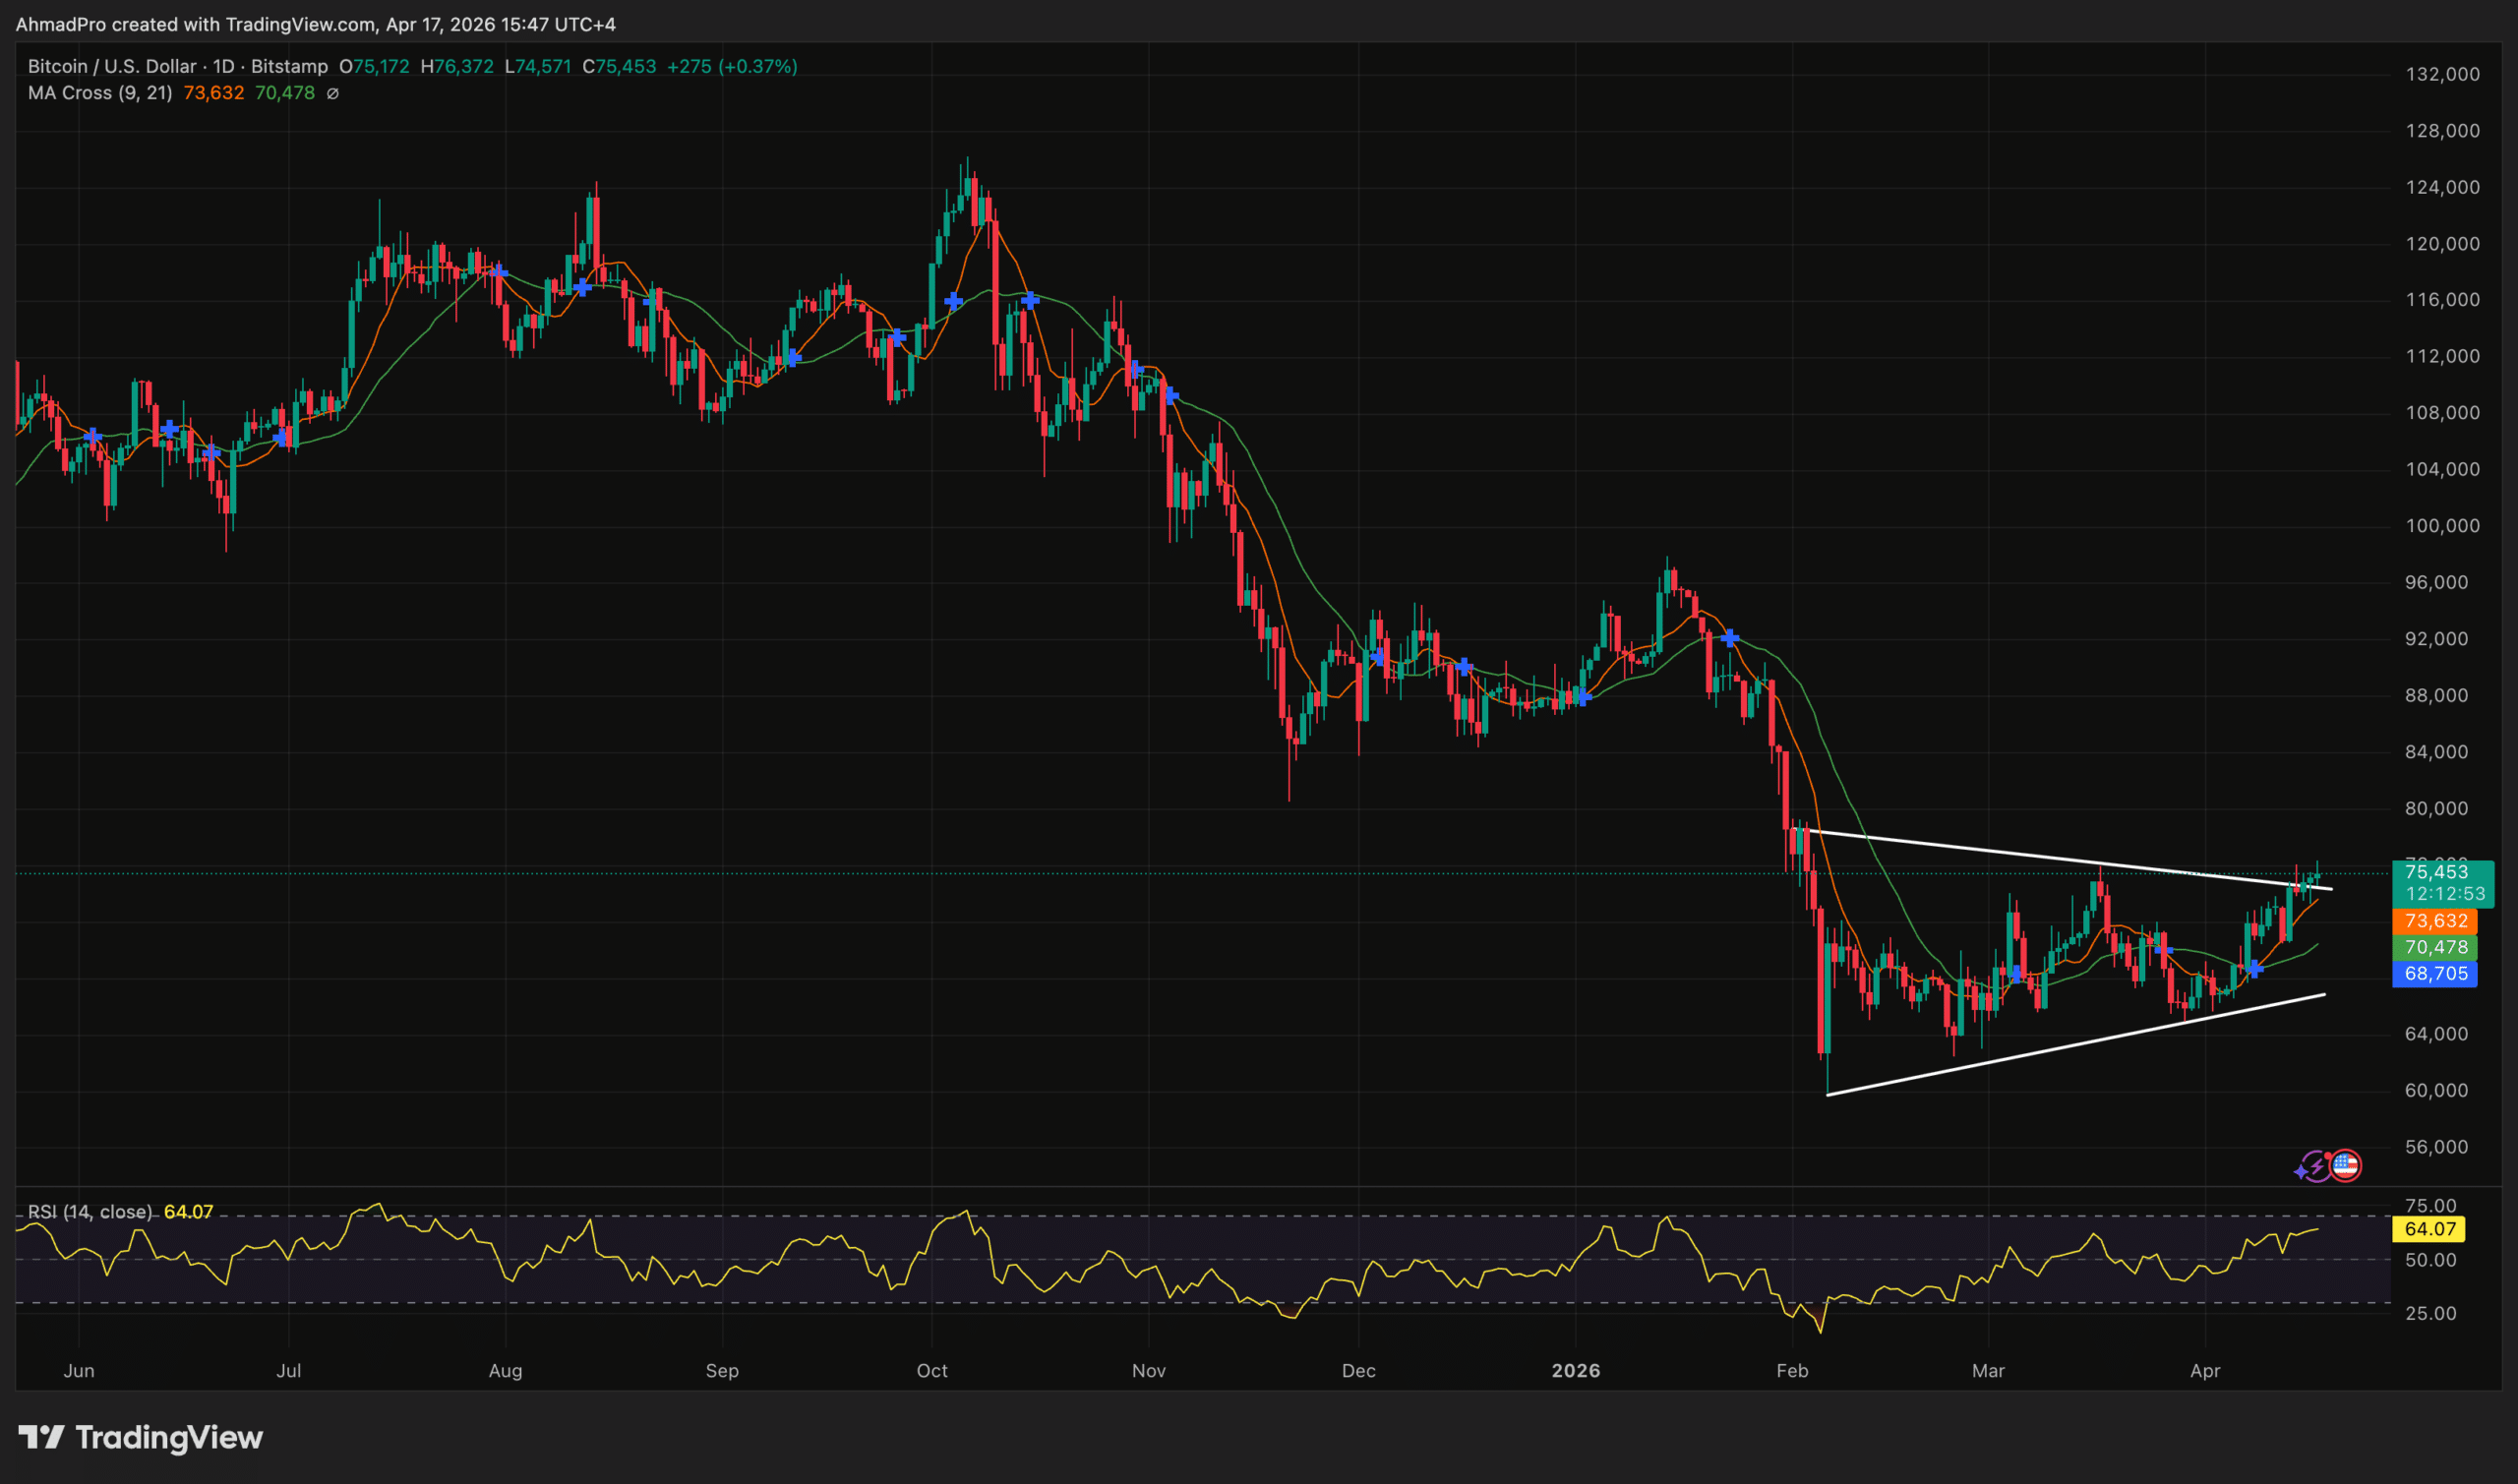
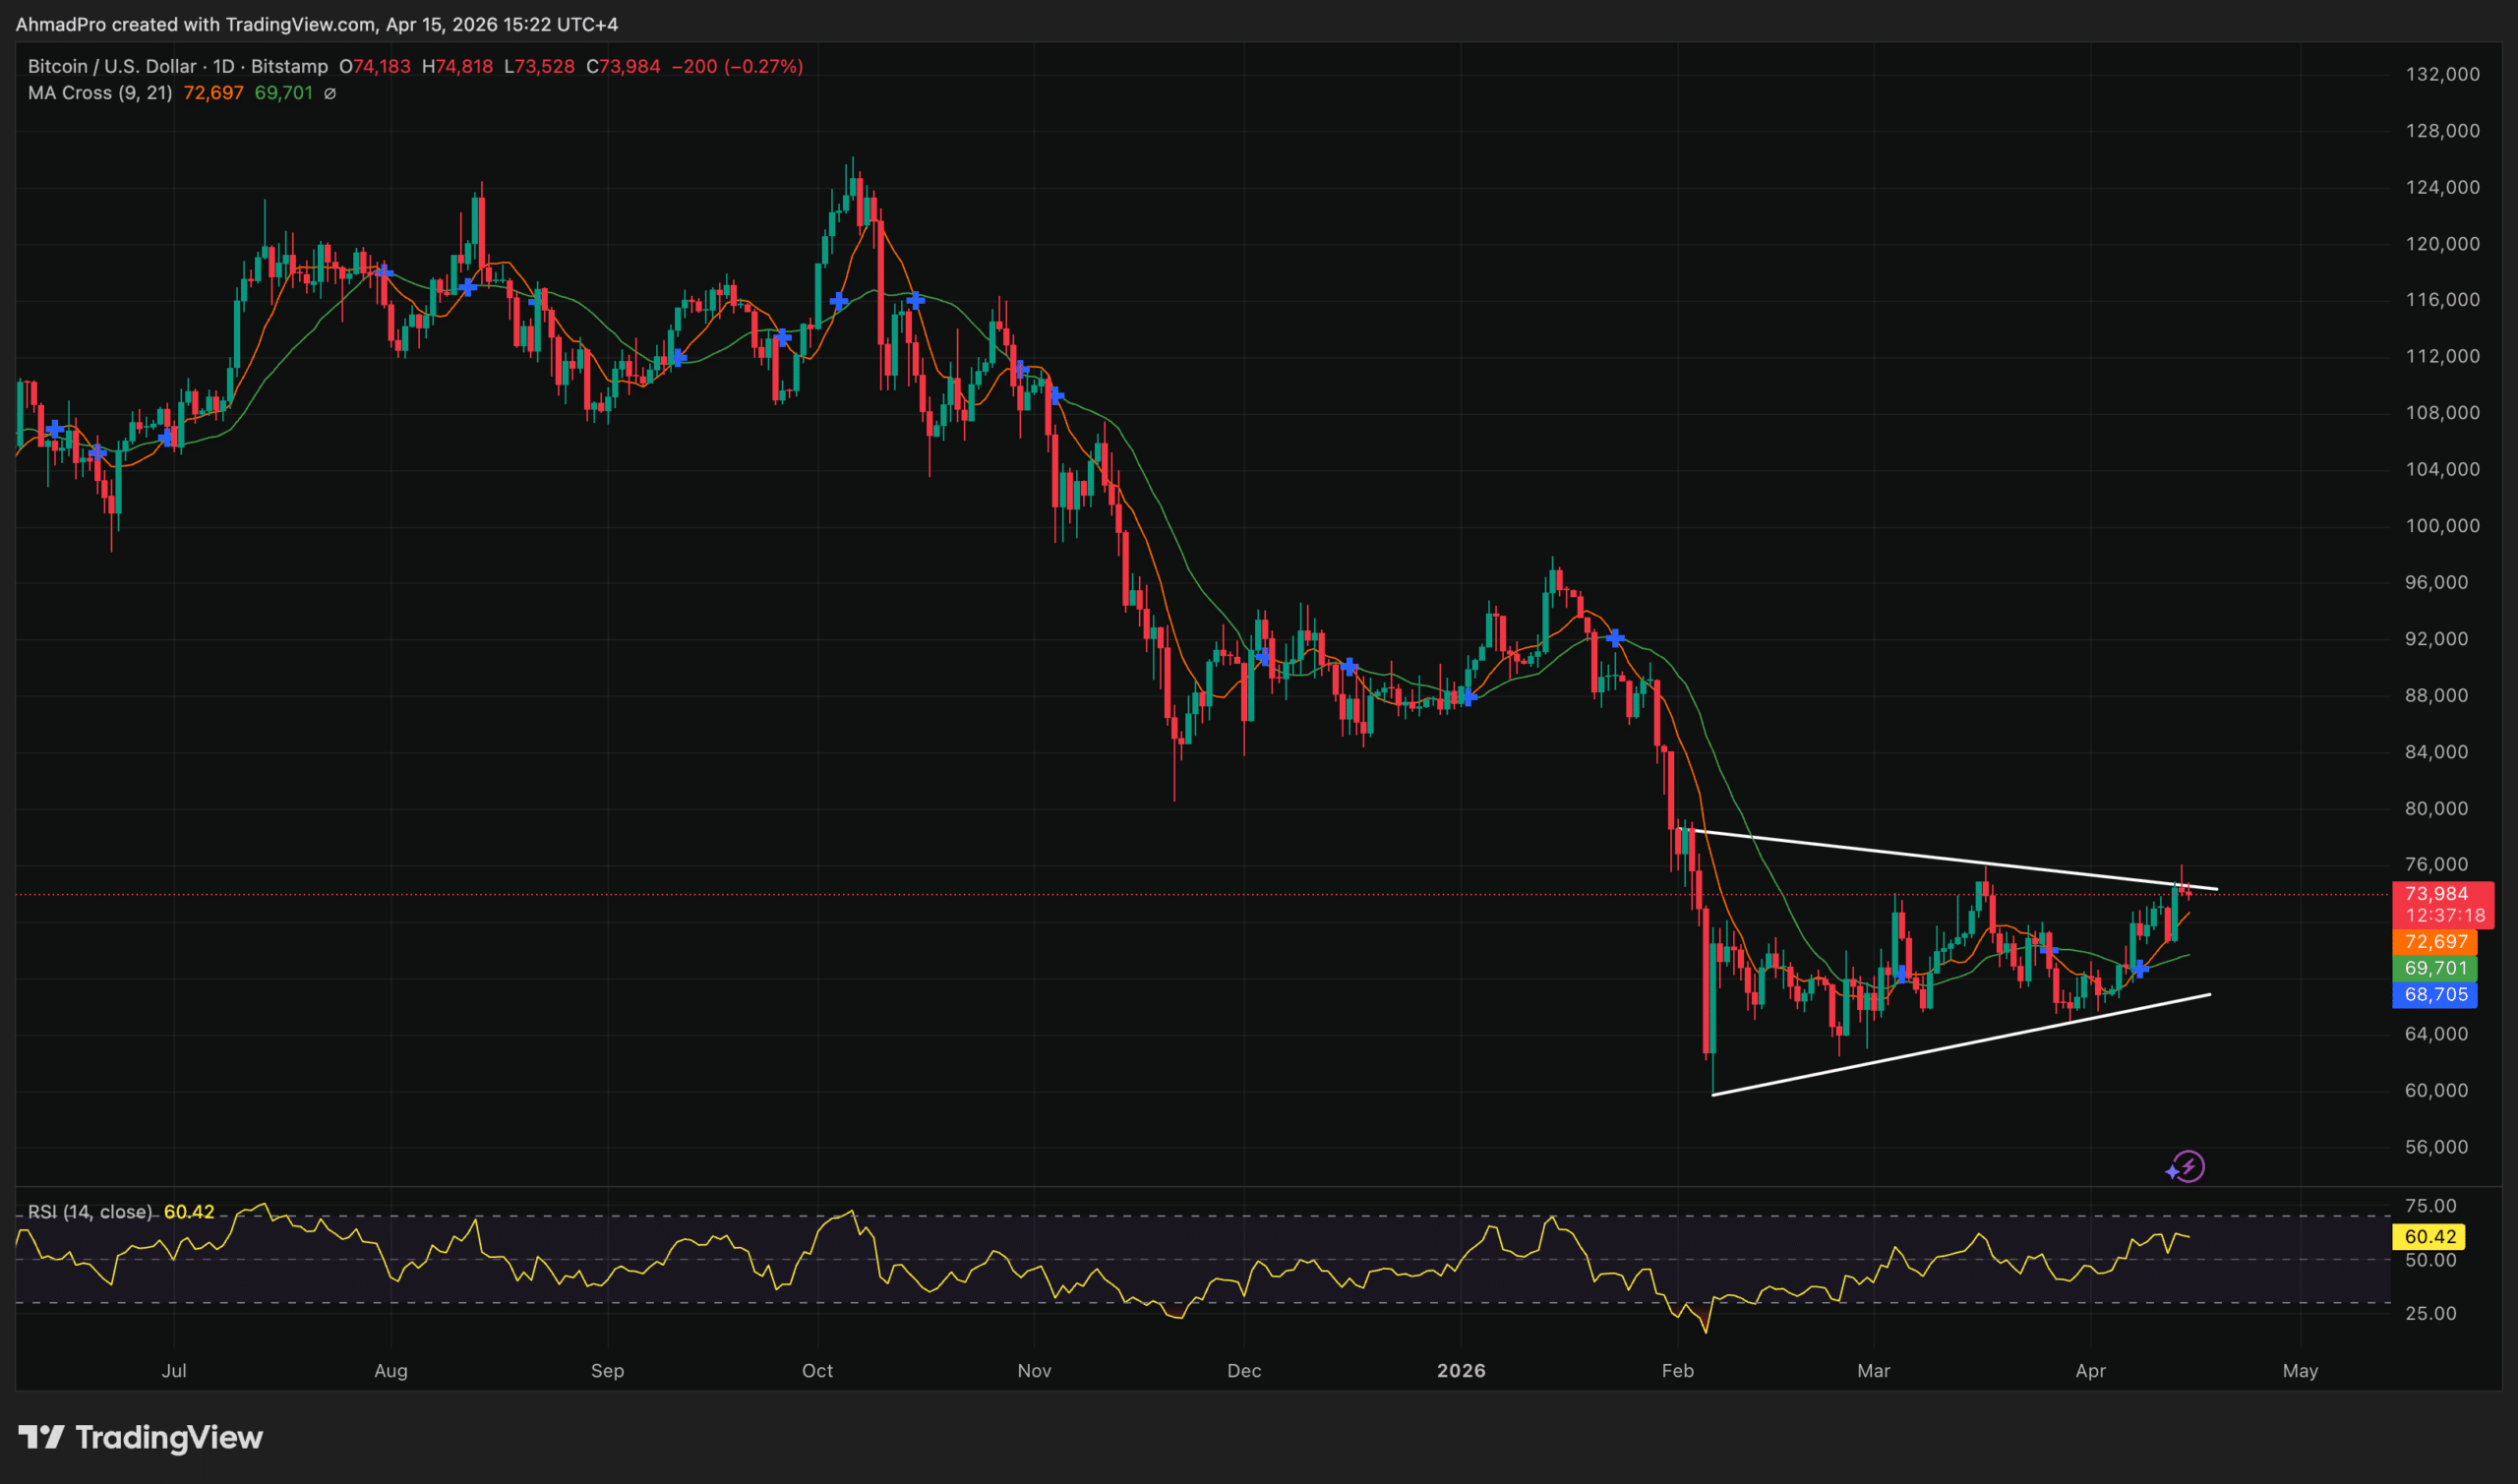
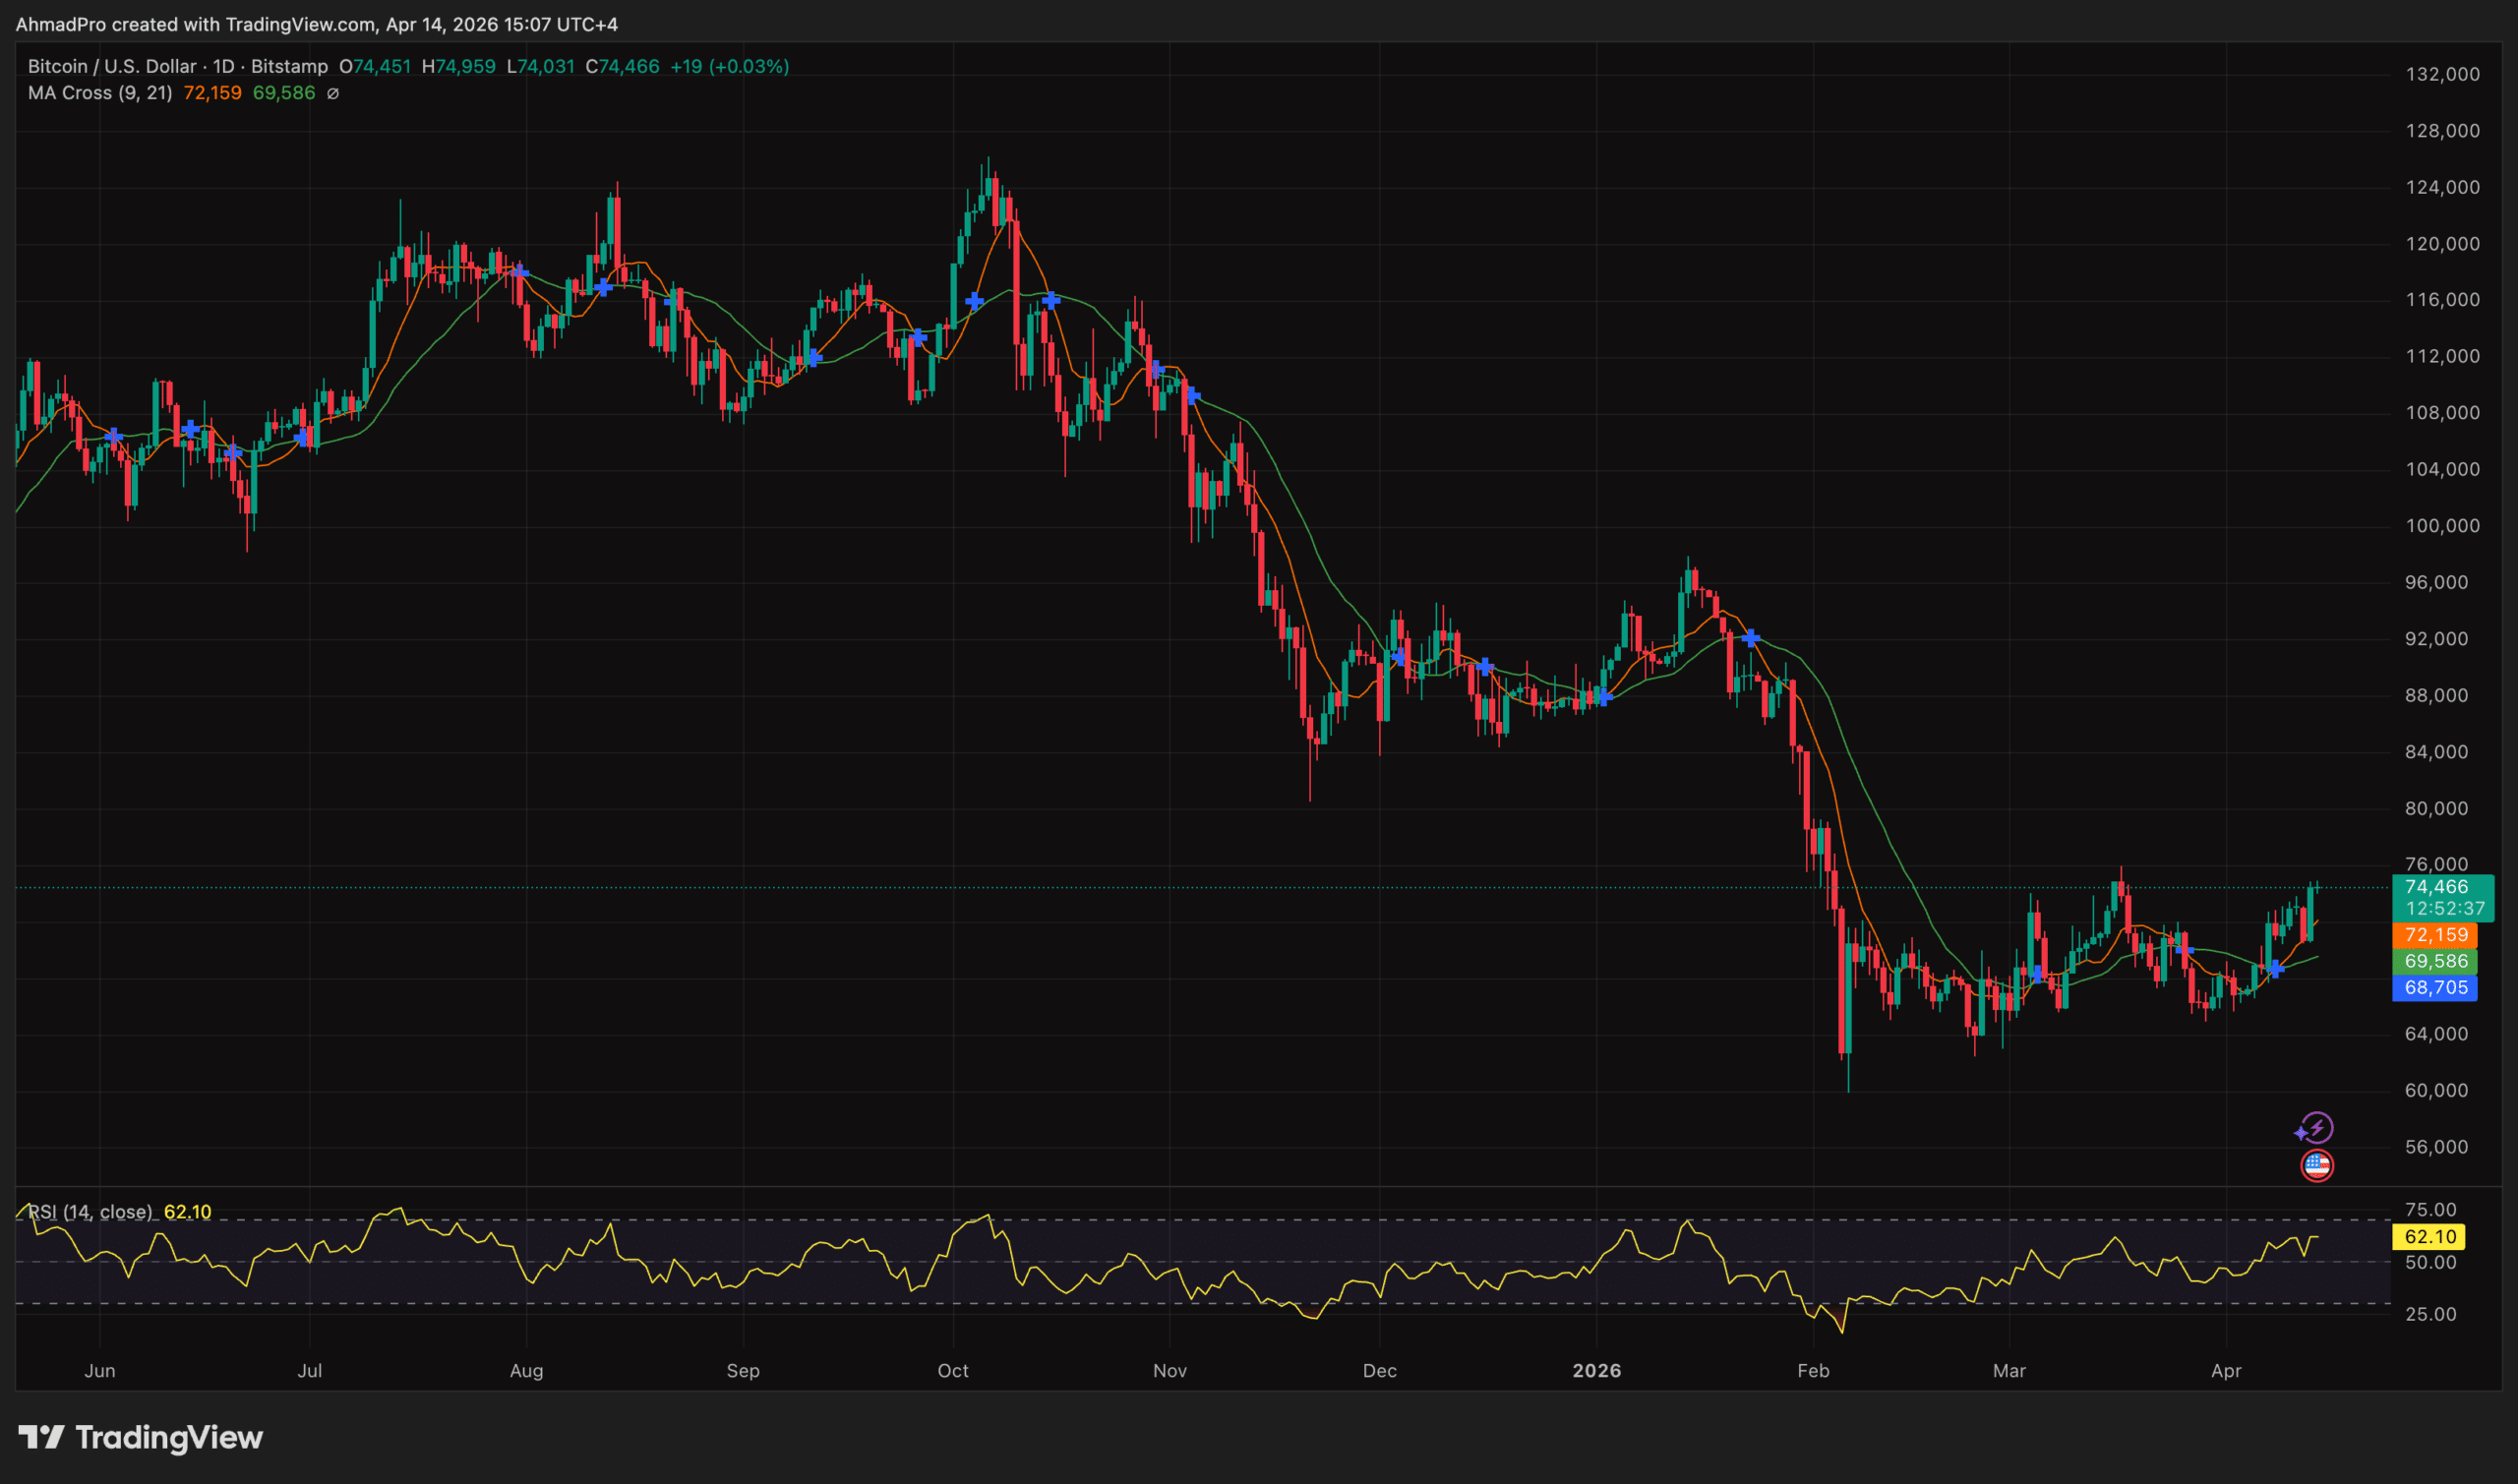
Bitcoin (BTC) price is trading above $74,000, while displaying an ascending triangle formation on the daily chart that technical analysts are characterizing as structurally bullish.
The analytical question is no longer whether Bitcoin has reclaimed critical support; it is whether the chart pattern carries sufficient confirmation to project the $90,000 target it implies, or whether the breakout is a tactical relief move that still lacks the on-chain and macro underpinning to sustain follow-through.
The Ascending Triangle: What the Bitcoin Price Chart Structure Is Actually Showing
The pattern in question is an ascending triangle – a formation defined by a flat upper resistance boundary and a rising lower trendline, indicating that buyers are defending progressively higher lows while sellers concentrate around a fixed ceiling.
In Bitcoin’s case, the structure consolidated above $73,000 earlier in the week before the breakout move carried price above the $76,000 level, reclaiming territory not visited since early February 2026.
The textbook signal from an ascending triangle is straightforward: the pattern implies that buying pressure is intensifying relative to supply at the resistance level, and a clean break above that ceiling projects a measured move equal to the height of the triangle’s widest point.
Applied to the current formation, that measured move targets approximately $90,000 – consistent with the resistance cluster that capped Bitcoin during the late-2025 rally phase. That distinction matters because $90,000 is not simply a round number here; it represents a prior structural ceiling that, if converted to support, would represent a meaningful shift in market architecture.
Historical precedent on Bitcoin’s chart suggests ascending triangles that form after a double-digit percentage decline and resolve above a multi-month resistance level have typically preceded sustained directional moves rather than immediate reversals.
The critical condition, however, is that the breakout must hold on a daily closing basis above the prior resistance – a threshold Bitcoin has yet to convincingly defend. Until a sustained daily close above $76,000–$80,000 is confirmed, the pattern is better characterized as a developing setup than a confirmed breakout.
On-Chain Transmission: Network Activity Supports the Pattern Thesis
The technical setup does not exist in isolation. According to CryptoQuant data, Bitcoin’s daily transaction count reached 765,130 as of April 5, 2026 – a 17-month high that exceeds activity levels recorded during several prior high-price periods, signaling sustained network engagement rather than speculative froth concentrated in derivatives.
Glassnode data corroborates the picture, showing total on-chain fee volume rising approximately 4% week-over-week to around $153,700, aligning with the price recovery and indicating that the bounce is accompanied by real economic activity on the network.
This transmission mechanism matters for evaluating the pattern’s validity: ascending triangles that break out on low network activity have historically been more vulnerable to immediate retests, while breakouts occurring alongside expanding transaction counts and fee volumes carry stronger structural support. The current on-chain readings are providing the fundamentals layer the chart pattern needs – though they confirm participation, not necessarily direction from here.
Institutional price forecasts remain divergent, adding another layer of interpretive complexity. Standard Chartered revised its 2026 year-end Bitcoin forecast downward from $200,000 to $100,000, citing slower corporate treasury adoption and heavier reliance on ETF inflows – a revision that still places the $90,000 target as an interim milestone rather than a ceiling.
Bernstein, by contrast, raised its 2026 target to $150,000, characterizing the current cycle as structurally broken from the four-year pattern due to persistent institutional buying. For a broader context on how institutional projections have evolved, the trajectory of Standard Chartered’s Bitcoin price calls illustrates how rapidly the institutional consensus has shifted.
Disclaimer: Coinspeaker is committed to providing unbiased and transparent reporting. This article aims to deliver accurate and timely information but should not be taken as financial or investment advice. Since market conditions can change rapidly, we encourage you to verify information on your own and consult with a professional before making any decisions based on this content.
Daniel Frances is a technical writer and Web3 educator specializing in macroeconomics and DeFi mechanics. A crypto native since 2017, Daniel leverages his background in on-chain analytics to author evidence-based reports and deep-dive guides. He holds certifications from The Blockchain Council, and is dedicated to providing "information gain" that cuts through market hype to find real-world blockchain utility.
Bitcoin (BTC) price is trading above $74,000, recovering sharply after weeks of geopolitical pressure tied to escalating Iran-US hostilities that had pinned the asset in a stubborn $73,000–$74,000 resistance band.
The analytical question is no longer whether Bitcoin can reclaim that level – it is whether a rebound occurring against a backdrop of unresolved Middle East tensions reflects durable structural demand or a tactical short squeeze that still lacks confirmation from patient capital.
Cross-Asset Transmission: Risk-On Snapback Absorbs the Geopolitical Premium
The macro transmission mechanism here is a classic risk-on rotation rather than a geopolitical resolution. Equity markets opened Monday with a bid, crypto-related equities closed higher across the board, and Bitcoin tracked the broader appetite for risk assets – not a reduction in the underlying tension.
Circle stock advanced 12%, Bullish gained 7.5%, and Coinbase added 3.9%, suggesting the move was correlated and sector-wide rather than idiosyncratic to Bitcoin alone.
Crude oil remained elevated above $100 per barrel amid continued Strait of Hormuz closure concerns, which ordinarily would suppress risk appetite through inflation and stagflation fears.
That Bitcoin gained ground in this environment – outperforming gold, which declined further, and the S&P 500 – suggests the asset is increasingly absorbing a portion of the geopolitical hedge bid that has historically belonged to precious metals and Treasuries.
Analysts at VanEck, specifically markets specialist Menno Martens, have noted that crypto’s resilience during off-hours market dislocations reflects growing institutional recognition of tokenized commodities and perpetual futures as legitimate hedging mechanisms. That structural shift in perception may explain why Bitcoin’s recovery from the ceasefire collapse has been faster and more sustained than prior geopolitical drawdowns.
Bitcoin (BTC) Price: The $74,000 Reclaim and the Key Resistance Overhead
The $73,000–$74,000 band had acted as a ceiling for approximately two weeks before Monday’s session, with multiple attempts to establish a higher base failing to hold. The current print above $74,000 represents the first sustained reclaim of that level, though confirmation requires a close above it rather than an intraday wick.
The next meaningful resistance cluster sits near $76,000, which aligns with the prior swing high established before the initial Iran-US escalation triggered the June sell-off. On the downside, $72,000 has emerged as near-term support – a level that had served as resistance during the prior ceasefire-driven rally and is now being tested as a floor. A daily close below $72,000 would suggest the reclaim of $74,000 was a failed breakout rather than a structural shift.
Approximately $344 million in total crypto liquidations occurred over the 24-hour rebound window, with short liquidations accounting for roughly 83% of that figure. That forced covering amplified the upward price movement mechanically, which means some portion of Monday’s gain reflects positioning unwind rather than fresh directional buying – a distinction that matters for assessing follow-through.
Disclaimer: Coinspeaker is committed to providing unbiased and transparent reporting. This article aims to deliver accurate and timely information but should not be taken as financial or investment advice. Since market conditions can change rapidly, we encourage you to verify information on your own and consult with a professional before making any decisions based on this content.
Daniel Frances is a technical writer and Web3 educator specializing in macroeconomics and DeFi mechanics. A crypto native since 2017, Daniel leverages his background in on-chain analytics to author evidence-based reports and deep-dive guides. He holds certifications from The Blockchain Council, and is dedicated to providing "information gain" that cuts through market hype to find real-world blockchain utility.
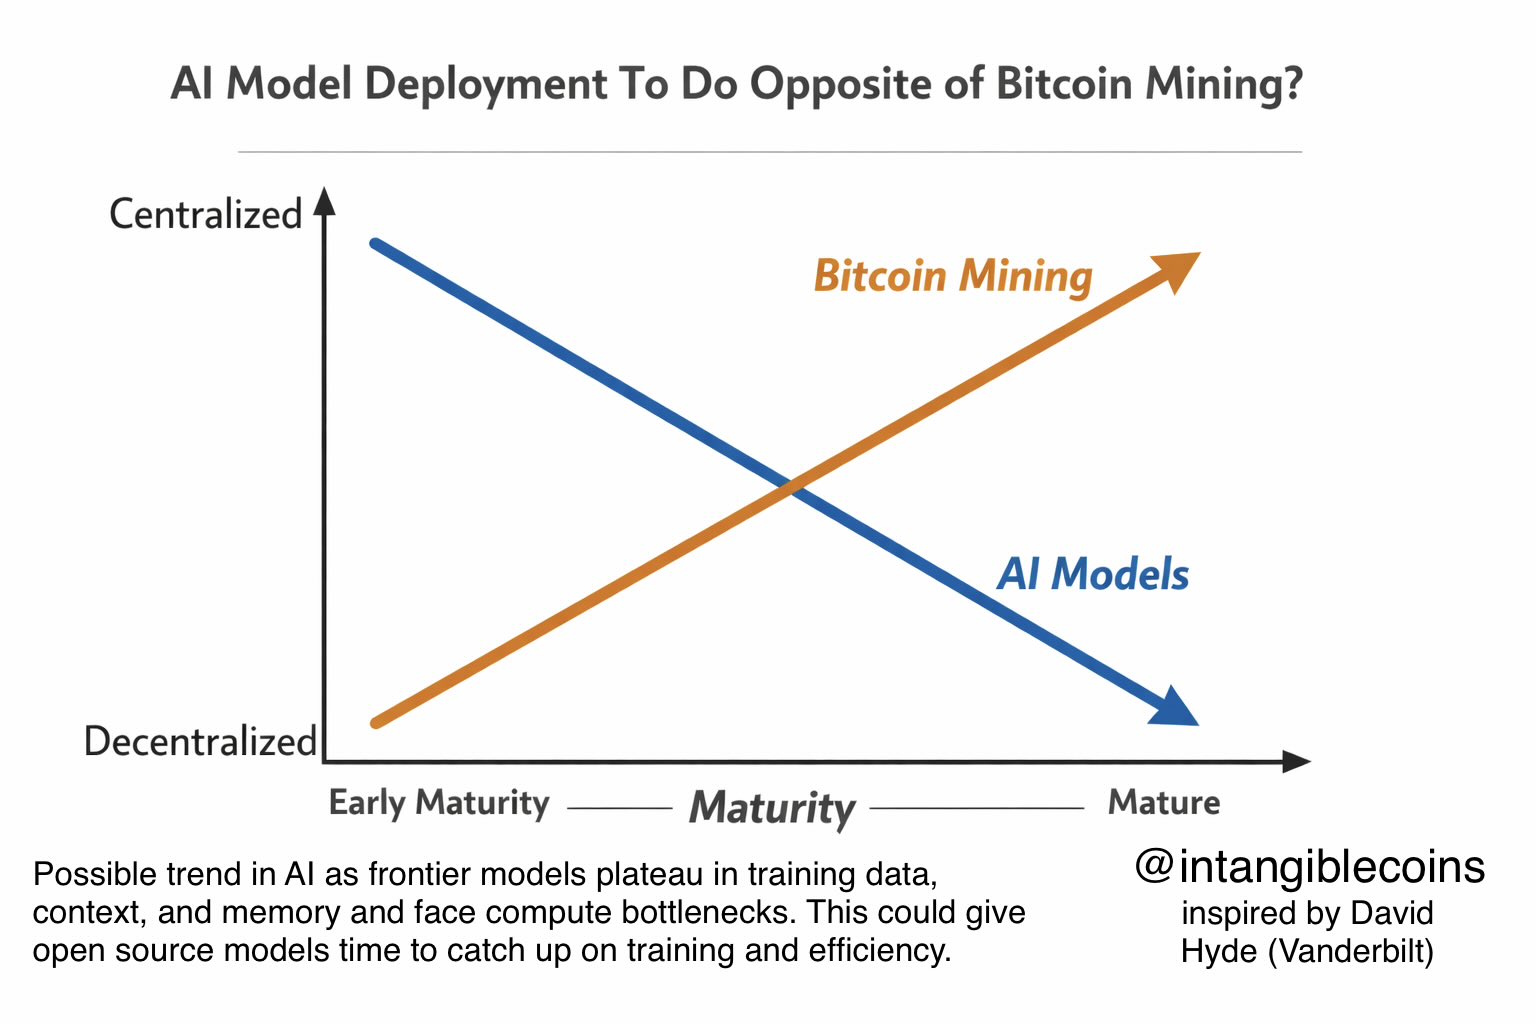
Bitcoin mining and artificial intelligence are moving in structurally opposite directions – and the divergence is widening fast enough to constitute a systemic risk signal for anyone pricing network resilience into their models.
According to analysis from Galaxy Research and Grand View Research, Bitcoin’s hashrate has consolidated dramatically from its early distributed architecture, while AI infrastructure is trending toward decentralization through edge computing deployments that distribute processing across nodes rather than concentrating it in centralized data centers.
The governing concept here is what we would call the Centralization Asymmetry: two of the most capital-intensive technology sectors are evolving in opposing directions at the same time, and the implications for network security, regulatory exposure, and investor risk models have not been adequately priced. Bitcoin was designed to be decentralized. AI was not – yet AI is now moving that direction faster than Bitcoin is holding its ground.
Bitcoin Mining Transmission Chain from ASIC Dominance to Pool Concentration
The transmission chain operates as follows: hardware manufacturing concentration feeds pool consolidation, which feeds hashrate dominance, which feeds protocol-level systemic risk. ASIC production is currently dominated by three firms – Bitmain, MicroBT, and Canaan – meaning that supply chain disruptions or regulatory interventions at the hardware level cascade directly into mining capacity. U.S. Customs has seized Bitmain equipment over compliance concerns in recent years, demonstrating that this is not a theoretical vulnerability.
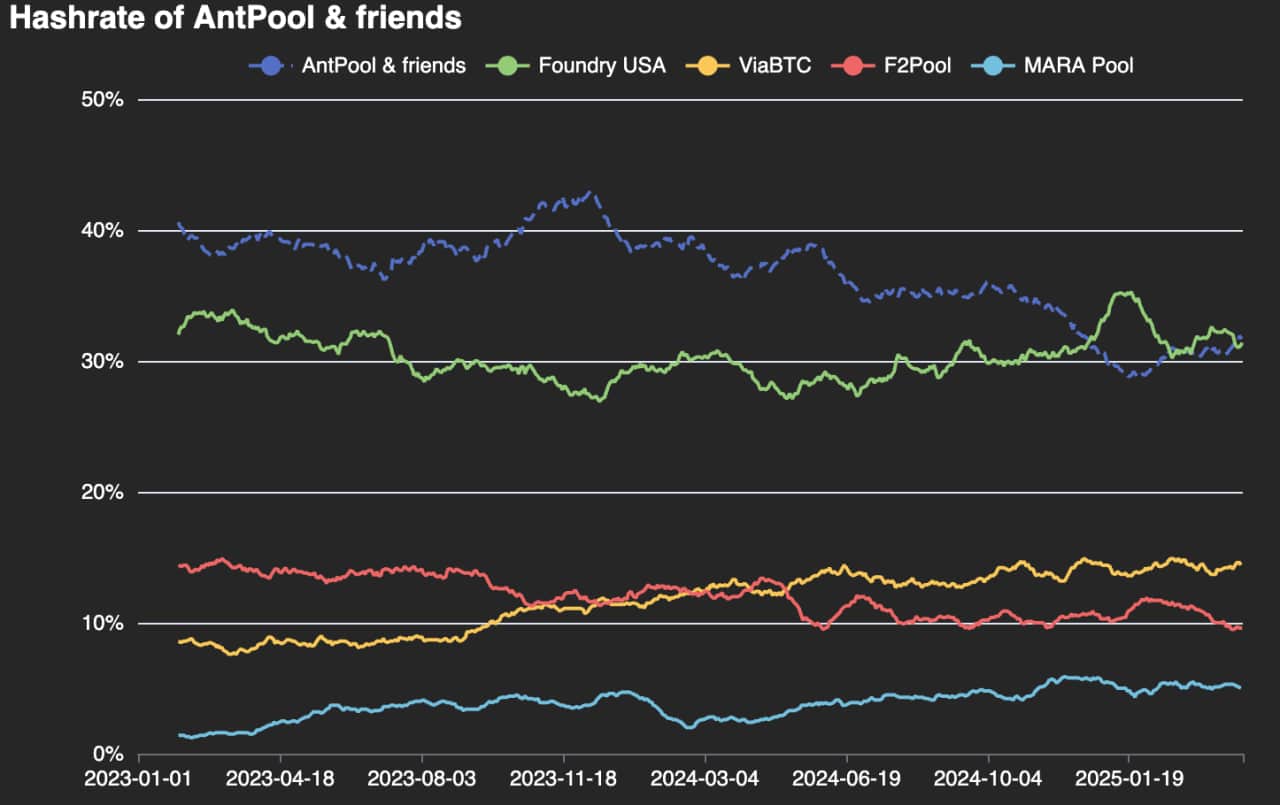
Pool-level concentration has worsened materially over the past two years. From 2019 through 2022, the top two pools held approximately 35% of global hashrate, with the top six accounting for roughly 75%.
By December 2023, those figures had climbed to 55% and 90% respectively, according to data tracked by b10c’s Mining Centralization Index – and conditions have deteriorated further into 2025. As of this year, the top four pools control an estimated 75% of hashrate, with the top six collectively mining 95% to 99% of all blocks.
In March 2025, Foundry USA mined seven consecutive blocks, in the process orphaning two valid blocks from AntPool and ViaBTC. No transactions were lost, but the episode illustrated precisely the kind of protocol stress that emerges under sustained hashrate concentration – a single pool’s dominance producing real interference in block propagation without triggering formal threshold alarms.
The parallel to the post-2021 China mining ban is instructive but imperfect: that episode temporarily redistributed hashrate across jurisdictions; the current consolidation is structural rather than geopolitical, and harder to reverse. Geopolitical disruptions can accelerate the problem too, as illustrated by the 77% collapse in Iran’s hashrate when regional conflict knocked an estimated 427,000 machines offline – removing a meaningful distributed participant and pushing effective concentration higher among surviving pools.
The AI Counter-Trend: Edge Computing and What the Divergence Actually Signals
The more consequential signal is not the centralization of Bitcoin mining in isolation – it is the simultaneous decentralization of AI infrastructure, which reframes the Centralization Asymmetry as something broader than a Bitcoin-specific governance debate.
Edge computing distributes inference and training workloads across geographically dispersed nodes, reducing dependence on hyperscaler data centers in a way that structurally mirrors Bitcoin’s original design intent.
The irony is difficult to miss: the technology sector Bitcoin mining was supposed to outcompete on decentralization grounds, is now executing the decentralization playbook more credibly.
We suspect this divergence is partly driven by economic factors that mining companies themselves have accelerated. Public miners pivoting facilities toward AI data center buildouts – reducing their Bitcoin hashrate commitments in favor of higher-margin compute leasing – are simultaneously amplifying pool dominance among the operators who remain and validating the AI infrastructure model they are migrating toward.
Bitfarms’ infrastructure pivot toward AI, executed under the Keel Infrastructure rebrand, is one of the more visible examples of this dynamic: a major mining operator reducing its hashrate footprint while allocating capital to the decentralizing infrastructure trend on the other side of the ledger.
What has not been adequately priced is the feedback loop. Each miner that exits Bitcoin for AI compute reduces the pool of independent hashrate contributors, which increases the relative weight of the remaining large pools, which worsens the Mining Centralization Index, which raises the probability of a protocol-level stress event that triggers regulatory scrutiny across all jurisdictions where mining operates at scale. The Centralization Asymmetry is not static – it compounds.
Disclaimer: Coinspeaker is committed to providing unbiased and transparent reporting. This article aims to deliver accurate and timely information but should not be taken as financial or investment advice. Since market conditions can change rapidly, we encourage you to verify information on your own and consult with a professional before making any decisions based on this content.
Daniel Frances is a technical writer and Web3 educator specializing in macroeconomics and DeFi mechanics. A crypto native since 2017, Daniel leverages his background in on-chain analytics to author evidence-based reports and deep-dive guides. He holds certifications from The Blockchain Council, and is dedicated to providing "information gain" that cuts through market hype to find real-world blockchain utility.
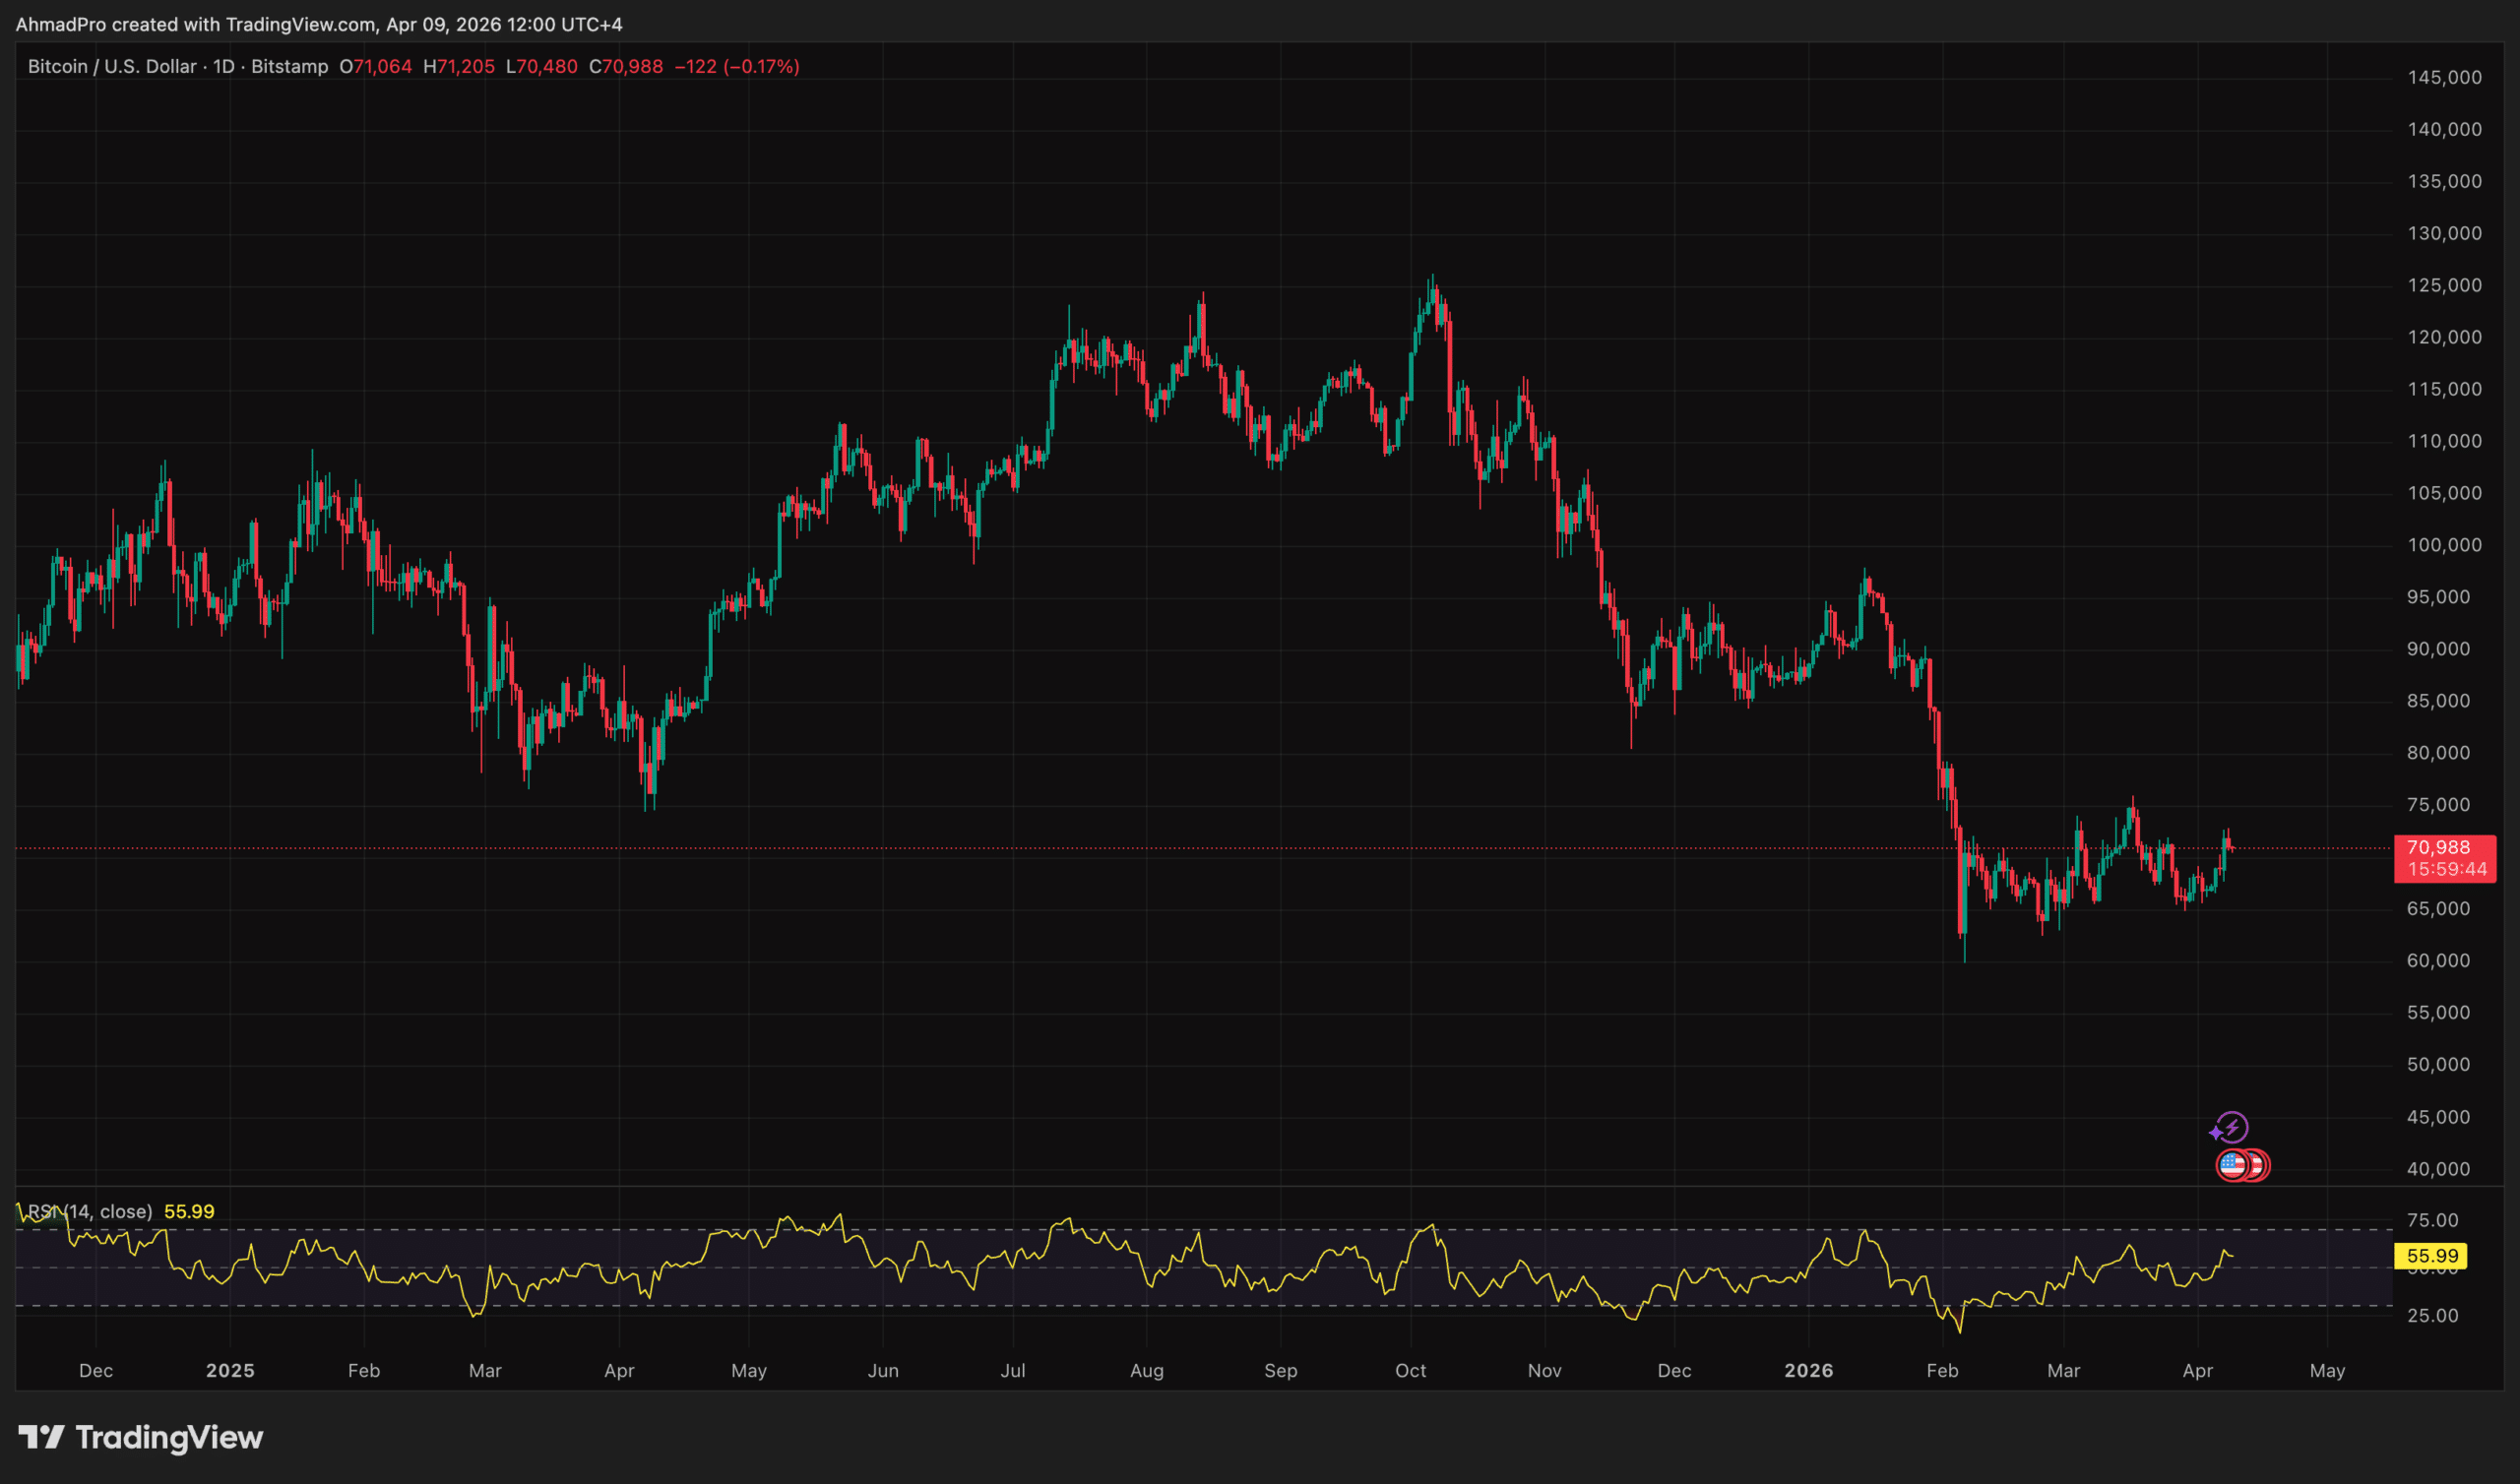
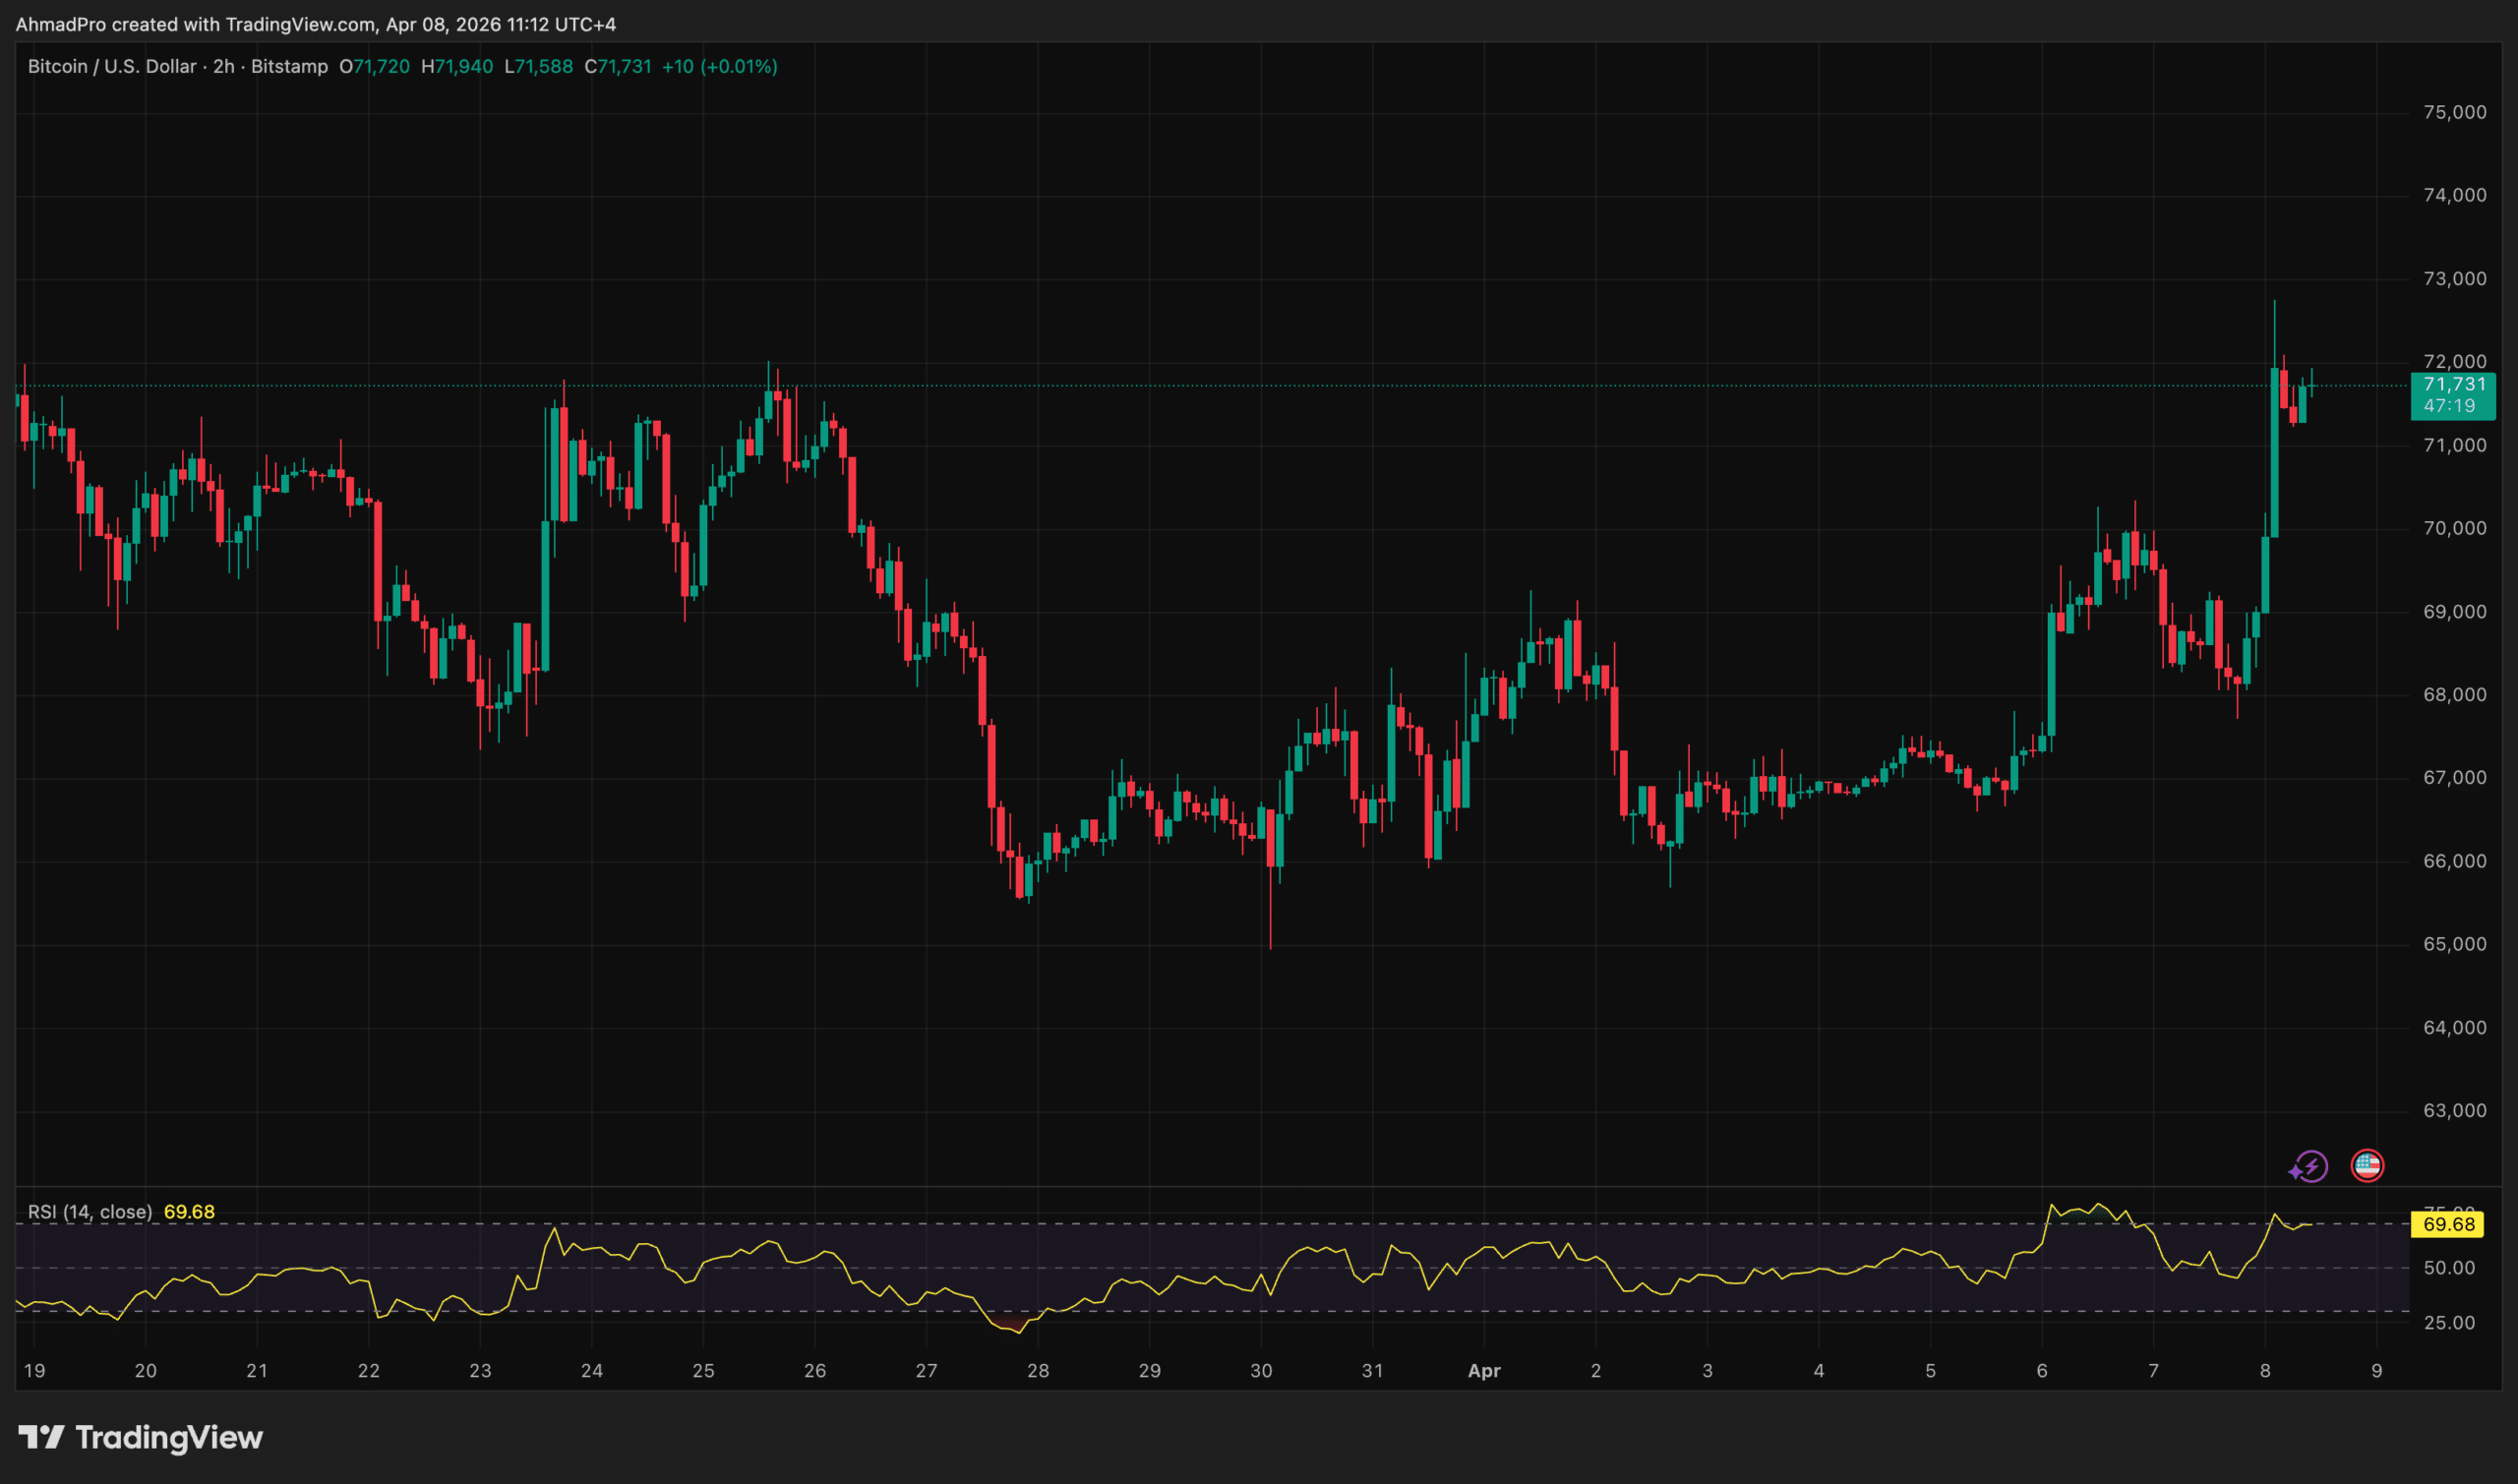
Bitcoin price is trading near $71,000, down 0.5% over the past 24 hours, as the two-week US-Iran ceasefire that drove Tuesday’s broad crypto rally began showing material signs of collapse less than 48 hours after it was announced.
The analytical question is no longer whether the relief trade can extend – it is how much of Tuesday’s gain unwinds if the ceasefire fails its first weekend stress test, and where the credible floor sits.
The Hormuz Re-Premium: How Ceasefire Doubt Transmits Into Crypto
The transmission mechanism here is direct. Iranian Parliament Speaker Mohammad Bagher Ghalibaf stated Thursday that three clauses of the ceasefire proposal had been contravened – without specifying which – while Israeli military operations continued in Lebanon and the Strait of Hormuz, nominally set to reopen under the deal, remained effectively closed with minimal tanker traffic.
— محمدباقر قالیباف | MB Ghalibaf (@mb_ghalibaf) April 8, 2026
That last point is the crux: the Hormuz reopening was the centerpiece of the agreement, and its failure to materialize means the energy risk premium the market briefly priced out on Tuesday is repricing back in.
Brent crude rebounded +2% to approximately $97 per barrel after Wednesday’s single-day collapse of more than 10% – its worst daily decline in six years. The reversal reflects a market that moved from pricing peace to pricing uncertainty within one trading session.
S&P 500 futures pointed to a 0.2% decline Thursday, signaling the end of a four-day winning streak for global equities. The MSCI Asia Pacific Index fell 0.9%, with two stocks declining for every one that rose, erasing a portion of Wednesday’s ceasefire-driven surge.
Treasuries were steady after an earlier rally faded on concern that higher oil prices would feed back into inflation expectations, which brings in the second transmission layer.
The Federal Reserve has continued to flag upside inflation risks alongside softening labor data, keeping the higher-for-longer rate narrative intact. Analysts at Bitunix characterized the combination as a dual shock from global energy repricing and Federal Reserve policy constraints, flagging that officials face a difficult balancing act between energy-driven inflation and weakening employment conditions.
Bitcoin Price: The $70,582 Floor and the $71,766 Resistance That Rejected Price
Bitcoin’s technical structure remains bounded by the $65,000–$73,000 range that has contained every significant move since late February, but the asset is now testing the upper half of that range rather than grinding along the bottom – which, under the circumstances, is the more constructive observation available.
The immediate concern is that BTC faced technical rejection at the 23.6% Fibonacci retracement at $71,766 and has since fallen below its 7-day moving average at $71,342, with futures open interest dropping 4.25% in a single session amid broader deleveraging.
Key support levels to watch: the 50% Fibonacci retracement at $70,582, the 61.8% level at $70,052, and the swing low at $68,338 – which represents the full round-trip scenario if the ceasefire formally unravels.
Bitcoin price hit an intraday peak of $76,013 earlier in the week before retreating; Thursday’s $70,981 print marks a 6.6% pullback from that high. The $65,000–$73,000 macro range is still intact, but the burden of proof has shifted back to the bull side.
Right now Bitcoin is trading straight off geopolitics, not pure technicals, because if the ceasefire actually holds and oil cools down, especially with Brent dropping under $90, that takes pressure off the macro side and gives BTC room to reclaim the short term trend above $71.3K and push back into the $73K to $74K zone.
But the market is clearly not fully buying that outcome yet, because the downside is still very real, and if tensions flare up again and oil spikes past $100, Bitcoin likely loses that $70K area and starts sliding toward the high $60s, with $65K back in play as a deeper floor.
So this is one of those moments where direction is not coming from charts alone, it is coming from headlines, and right now both paths are open, with the market actively pricing in the risk that things can turn negative just as quickly as they improve.
Disclaimer: Coinspeaker is committed to providing unbiased and transparent reporting. This article aims to deliver accurate and timely information but should not be taken as financial or investment advice. Since market conditions can change rapidly, we encourage you to verify information on your own and consult with a professional before making any decisions based on this content.
Daniel Frances is a technical writer and Web3 educator specializing in macroeconomics and DeFi mechanics. A crypto native since 2017, Daniel leverages his background in on-chain analytics to author evidence-based reports and deep-dive guides. He holds certifications from The Blockchain Council, and is dedicated to providing "information gain" that cuts through market hype to find real-world blockchain utility.
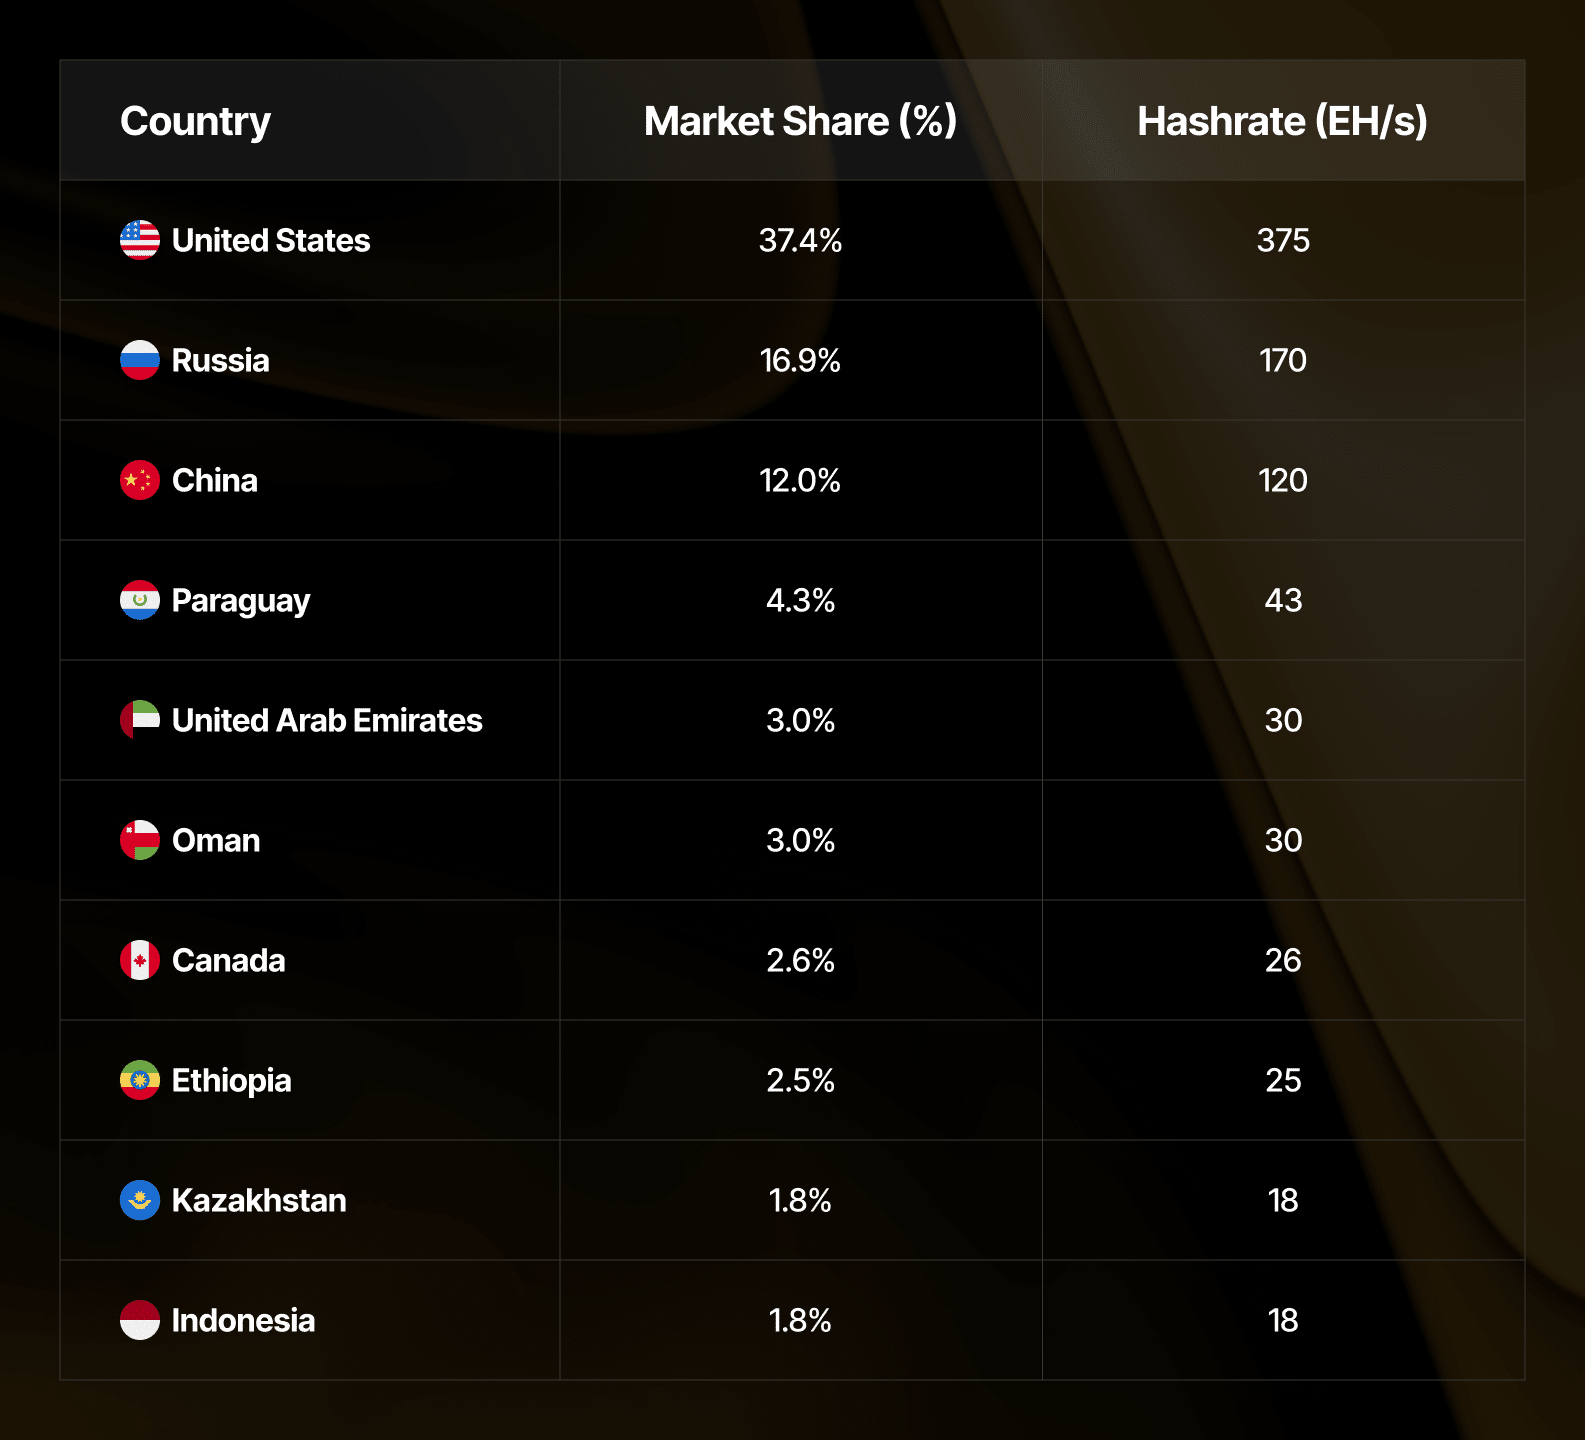
Iran Bitcoin hashrate fell approximately 77% over the past quarter – from roughly 9 exahashes per second to 2 EH/s, as U.S. and Israeli military strikes disrupted power infrastructure and forced an estimated 427,000 active mining machines offline, according to a Hashrate Index report published Monday by Ian Philpot, marketing director at Luxor Technology.
The loss represents approximately 7 EH/s quarter-over-quarter and marks the most severe regional hashrate contraction since China’s 2021 mining ban.
The immediate implication is geographic redistribution rather than network degradation. Global hashrate has held near 1,000 EH/s throughout the disruption, a figure that underscores the decentralized architecture Bitcoin’s proof-of-work security model was designed to preserve.
Iran Bitcoin Mining Collapse: Infrastructure Strikes and the Conflict Discount on Hashrate
The transmission chain operates as follows: U.S. and Israeli strikes beginning in February targeted Iranian infrastructure broadly, cutting reliable grid access to industrial mining facilities that had operated under government license since Iran legalized Bitcoin mining in 2019.
Iran had built its mining sector deliberately around sanctioned-economy incentives – subsidized hydroelectric power and a mechanism to monetize energy exports that bypassed dollar-denominated settlement. That strategy gave Iranian operators a structural cost advantage that evaporated the moment grid stability became uncertain.
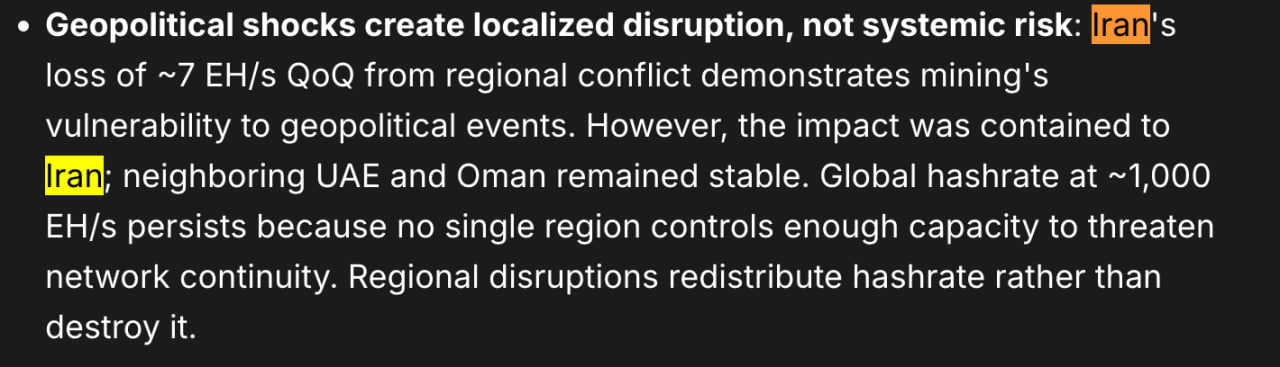
Philpot noted that while the conflict clearly contained its impact within Iranian borders, a spillover risk to neighboring UAE and Oman existed, given regional energy interdependencies – a risk that has not materialized. “The impact was contained to Iran; neighboring UAE and Oman remained stable,” he wrote. “The global hashrate at ~1,000 EH/s persists because no single region has enough capacity to threaten network continuity.
Regional disruptions redistribute hashrate rather than destroy it.” The 7 EH/s lost from Iran represents less than 0.7% of the network’s pre-conflict capacity, which contextualizes why global figures absorbed the shock without measurable security degradation. A two-week ceasefire between the U.S. and Iran was reached Tuesday, though the durability of that arrangement – and any infrastructure restoration timeline – remains unclear.
Bitcoin’s difficulty algorithm adjusts every 2,016 blocks – roughly every two weeks – to maintain a ten-minute average block time regardless of how much hashrate enters or exits the network. Iran’s 7 EH/s loss is meaningful at a regional level but statistically modest against a 1,000 EH/s global baseline; the difficulty adjustment would absorb that volume in a single recalibration cycle without material impact to block interval or transaction finality.
The more consequential difficulty signal is elsewhere: the 30-day simple moving average of global hashrate declined from 1,066 EH/s in Q1 to approximately 1,004 EH/s in Q2, a 5.8% quarter-over-quarter drop that Philpot attributed primarily to Bitcoin’s price collapse rather than geopolitical disruption.
Bitcoin has fallen more than 45% from its all-time high of $126,000 set in October, according to CoinGecko data, pushing hash prices to record lows and forcing an estimated 252 EH/s of older, less efficient ASICs offline globally. The parallel to the post-2021 China mining ban is instructive but imperfect: China’s 2021 exit removed 50–70% of global hashrate in weeks, triggering multiple consecutive negative difficulty adjustments before capacity migrated to the U.S. and Kazakhstan.
Iran’s loss is an order of magnitude smaller and has produced no comparable adjustment cascade. We suspect the Q2 difficulty softness is predominantly a profitability story – miners voluntarily curtailing marginal machines – rather than a conflict story. The Iran disruption is a regional footnote within a globally price-driven contraction.
Disclaimer: Coinspeaker is committed to providing unbiased and transparent reporting. This article aims to deliver accurate and timely information but should not be taken as financial or investment advice. Since market conditions can change rapidly, we encourage you to verify information on your own and consult with a professional before making any decisions based on this content.
Daniel Frances is a technical writer and Web3 educator specializing in macroeconomics and DeFi mechanics. A crypto native since 2017, Daniel leverages his background in on-chain analytics to author evidence-based reports and deep-dive guides. He holds certifications from The Blockchain Council, and is dedicated to providing "information gain" that cuts through market hype to find real-world blockchain utility.
Morgan Stanley spot Bitcoin ETF enters a crowded market with a structural advantage its competitors cannot easily replicate – a captive distribution network that Bloomberg Senior ETF Analyst Eric Balchunas argues could translate into durable, advisor-directed inflows from day one.
Ahead of the fund’s anticipated debut, Balchunas framed the bank’s roughly 16,000 financial advisors not as a sales force but as an embedded demand channel, one that operates differently from the retail-driven flows that have defined the ETF market’s first phase.
The mechanical distinction matters. When an independent ETF issuer launches a product, inflows depend on retail sentiment, institutional mandates, and open-market demand. When a wirehouse like Morgan Stanley launches its own fund, the distribution pathway runs through salaried advisors who manage existing client relationships – advisors who can recommend the product directly within fee-based accounts.
JUST IN: FDIC approves proposal to implement the requirements and standards for US stablecoins under the GENIUS Act 🇺🇸 pic.twitter.com/B4i93gAbnP
That is a structurally different inflow dynamic, and Balchunas is arguing it gives Morgan Stanley Bitcoin Trust (MSBT) a demand profile rivals cannot simply undercut on fees alone.
Morgan Stanley Bitcoin ETF (MSBT): Why the Wirehouse Model Changes the Inflow Equation
The core of Balchunas’s thesis rests on scale and captivity. Morgan Stanley’s advisor network serves clients across an institution managing $9.3 trillion in assets – a figure that dwarfs the asset bases of the crypto-native issuers that launched alongside BlackRock in January 2024.
Fidelity operates its own advisor channel, but Balchunas was explicit: “Morgan Stanley is on another level.” The difference is not merely headcount but the nature of the client relationship – Morgan Stanley advisors work within a full-service wealth management model where product recommendations carry significant weight.
The fee structure reinforces the competitive positioning. MSBT is set to debut with a 0.14% expense ratio, undercutting BlackRock’s iShares Bitcoin Trust ETF (IBIT) at 0.25% – a gap Balchunas described as “shocking” in its aggressiveness for an institution entering the space late. That pricing, combined with Morgan Stanley’s brand credibility, addresses the two variables most likely to determine advisor recommendation behavior: cost to the client and institutional legitimacy of the product. MSBT scores competitively on both.
JUST IN: BLOOMBERG JUST REPORTED LIVE
$10 TRILLION MORGAN STANLEY'S #BITCOIN ETF EXPECTED TO BEGIN "TRADING THIS WEEK"
"16,000 FINANCIAL ADVISORS" WILL SELL $MSBT AT LAUNCH
— The Bitcoin Historian (@pete_rizzo_) April 7, 2026
Morgan Stanley’s Global Investment Committee provided additional runway in 2024 when it recommended allocating up to 4% of investor portfolios to crypto for opportunistic growth. That internal endorsement functions as pre-cleared institutional cover – advisors recommending MSBT are not acting against firm guidance but in alignment with it.
The SEC’s approval of MSBT’s listing on the New York Stock Exchange removes the remaining regulatory friction, leaving the distribution engine without a structural impediment to activation.
Disclaimer: Coinspeaker is committed to providing unbiased and transparent reporting. This article aims to deliver accurate and timely information but should not be taken as financial or investment advice. Since market conditions can change rapidly, we encourage you to verify information on your own and consult with a professional before making any decisions based on this content.
Daniel Frances is a technical writer and Web3 educator specializing in macroeconomics and DeFi mechanics. A crypto native since 2017, Daniel leverages his background in on-chain analytics to author evidence-based reports and deep-dive guides. He holds certifications from The Blockchain Council, and is dedicated to providing "information gain" that cuts through market hype to find real-world blockchain utility.
The US Securities and Exchange Commission (SEC) acknowledged on Tuesday that a category of its prior crypto enforcement actions produced no meaningful investor benefit, misallocated agency resources, and reflected a misinterpretation of federal securities laws – a formal admission embedded in a public statement on its fiscal 2025 enforcement results.
The disclosure is not incidental: it constitutes an agency-level repudiation of enforcement choices made under former Chair Gary Gensler, delivered through an official press release carrying the institutional weight of the commission itself.
The downstream consequence is immediate and measurable. Firms that faced enforcement actions premised on the legal theories the SEC has now characterized as flawed, novel classifications of digital assets as securities, book-and-record violations divorced from demonstrable crypto market harm, hold a materially stronger position in any pending litigation or settlement negotiation.
🚨JUST IN: U.S. SEC admits some past crypto enforcement actions delivered no investor benefit and misinterpreted securities laws.
A major shift under Chair Atkins — showing a possible reset in how the US approaches crypto regulation.👀 pic.twitter.com/b6VWOUfY7Y
The admission also creates a documented record that courts in live proceedings will be positioned to receive as evidence of prior agency overreach.
We suspect the SEC’s decision to frame this repudiation in a formal enforcement results statement, rather than through quieter administrative closure, reflects a deliberate institutional signal directed as much at the federal judiciary as at the regulated industry.
By creating a written, attributable record of self-criticism, the commission under Chair Paul Atkins is not merely changing policy – it is constructing an evidentiary foundation that defense counsel in surviving enforcement actions can cite directly. The admission is strategic, not confessional.
Enforcement Architecture and the Investor Benefit Standard: How Prior SEC Crypto Cases Were Evaluated
The mechanism functions as follows: SEC enforcement actions are formally assessed against a standard of investor protection – the statutory mandate embedded in the Securities Exchange Act of 1934 and the Securities Act of 1933. An enforcement action that imposes penalties without a demonstrable nexus to investor harm or market integrity fails that standard, regardless of the technical legal violation alleged.
Since fiscal year 2022, the SEC has brought 95 actions and extracted $2.3 billion in penalties characterized as book-and-record violations – failures by firms to preserve off-channel communications. The commission’s own statement now describes that body of work as reflecting a “bias for volume of cases brought versus matters of investor protection.” Separately, the agency acknowledged seven crypto registration cases and six dealer definition cases from fiscal years 2022 through 2024 that applied novel legal theories without establishing clear investor harm.
The registration and dealer cases are not abstract procedural complaints. They include the high-profile enforcement actions against Coinbase, Binance, Gemini, Crypto.com, Robinhood, and Ondo Finance – all of which have since been dismissed following Atkins’ appointment in April 2025.
The SEC’s characterization of those cases as resource misallocations and statutory misreadings is a functional acknowledgment that the Gensler-era regulation-by-enforcement posture applied securities law in ways the agency itself can no longer defend. In the context of ongoing questions about how digital assets like XRP are classified under securities law, that admission carries structural weight well beyond the specific dismissed cases.
Atkins stated that the agency has “redirected resources toward the types of misconduct that inflict the greatest harm – particularly fraud, market manipulation, and abuses of trust – and away from approaches that prioritized volume and record-setting penalties over true investor protection.” That formulation is precise: it identifies the prior approach by its operative defect – volume and penalty size as proxies for institutional effectiveness – and displaces them with harm-specificity as the organizing principle.
The question of how courts will receive the SEC’s self-described enforcement failures is not hypothetical – it is already producing observable effects in active proceedings. Defense counsel in any matter premised on the registration or dealer-definition theories, the SEC has now disavowed, hold a documented agency admission that the underlying legal framework was misapplied. That is a materially different litigation posture than arguing against an agency confident in its prior positions.
We suspect federal courts will treat the SEC’s formal statement with particular attention in cases where the commission has not yet voluntarily dismissed, but where the underlying theory tracks the categories the agency now criticizes.
Judges evaluating motions to dismiss or summary judgment filings in surviving enforcement actions will find it difficult to ignore an agency’s own characterization of its prior legal interpretations as flawed – particularly where those interpretations form the backbone of the government’s affirmative case.
Disclaimer: Coinspeaker is committed to providing unbiased and transparent reporting. This article aims to deliver accurate and timely information but should not be taken as financial or investment advice. Since market conditions can change rapidly, we encourage you to verify information on your own and consult with a professional before making any decisions based on this content.
Daniel Frances is a technical writer and Web3 educator specializing in macroeconomics and DeFi mechanics. A crypto native since 2017, Daniel leverages his background in on-chain analytics to author evidence-based reports and deep-dive guides. He holds certifications from The Blockchain Council, and is dedicated to providing "information gain" that cuts through market hype to find real-world blockchain utility.
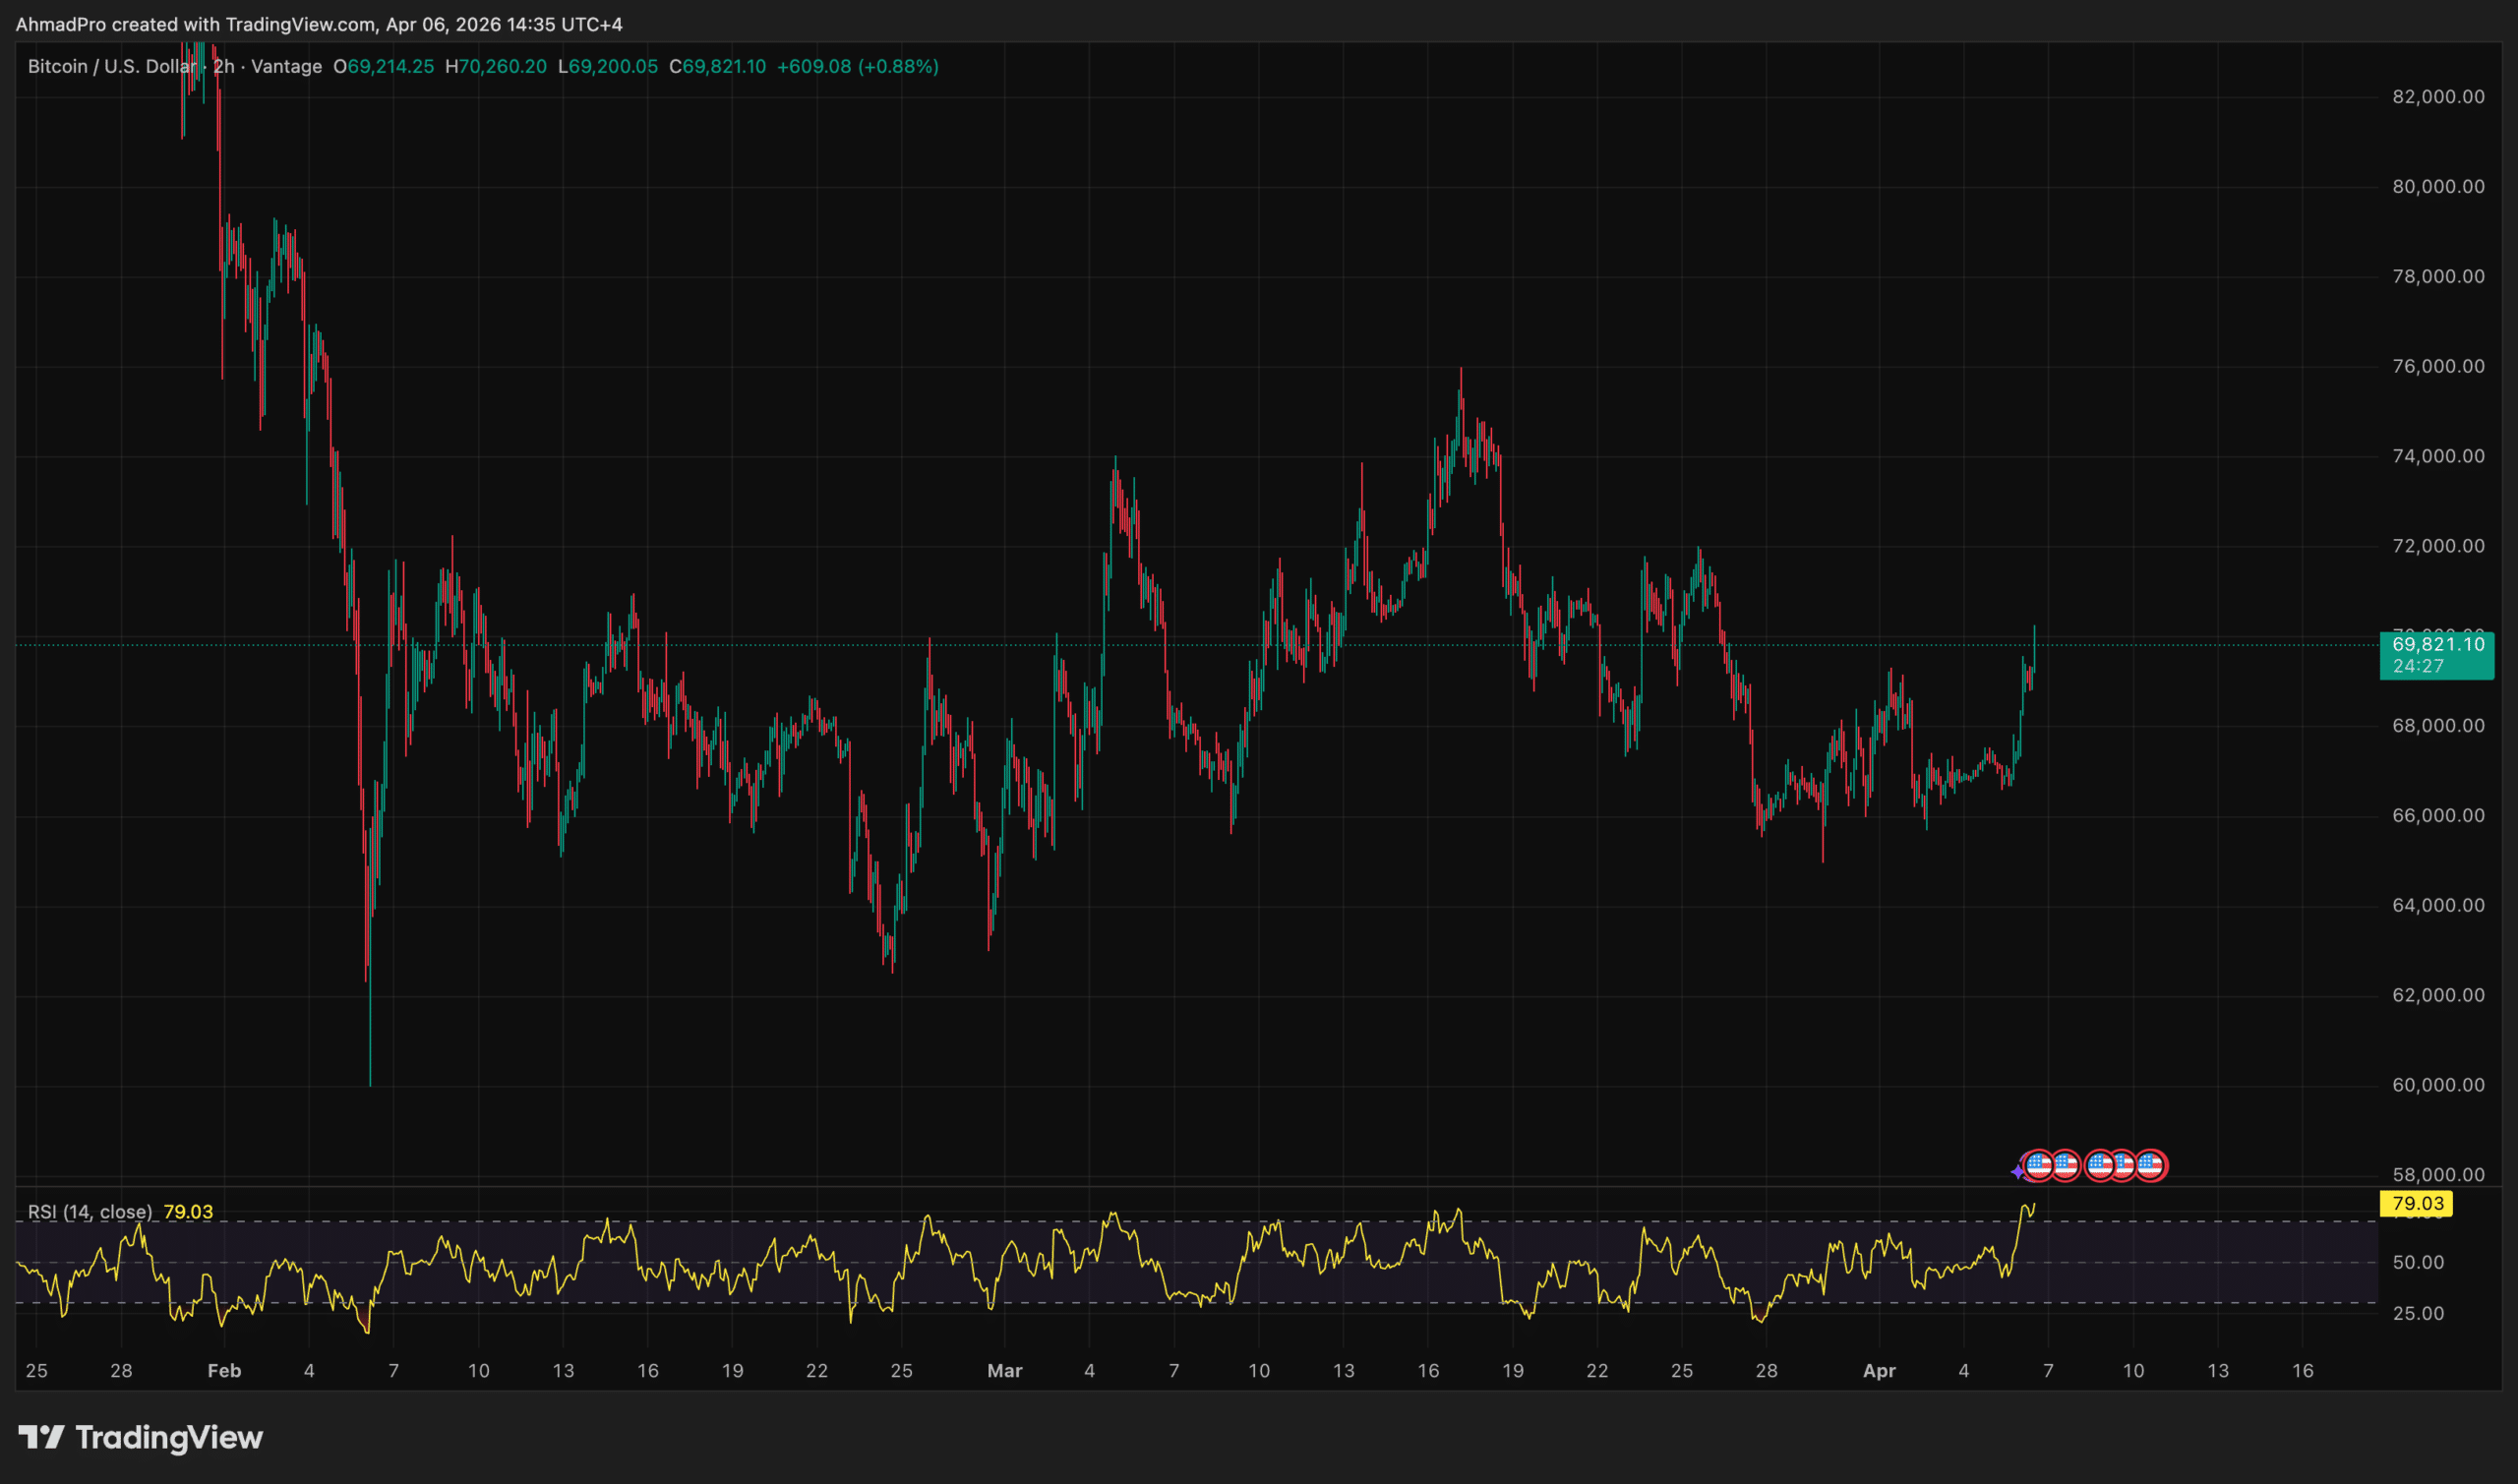
Bitcoin price is trading near $71,700, up +4% over the past 24 hours after briefly touching $72,753 intraday, its highest print in 20 days – as the US and Iran agreed to a two-week suspension of military hostilities.
The move erased weeks of geopolitical discount baked into price, but the analytical question is whether a temporary ceasefire, not a resolution, is sufficient to sustain a break above the psychological $72,000 threshold that has capped the market since mid-March.
US President Donald Trump announced via Truth Social on Tuesday that he would suspend military action against Iran for two weeks, hours before a deadline he had set for Tehran to reopen the Strait of Hormuz or face strikes on key infrastructure. Iran’s Supreme National Security Council accepted the ceasefire, though it explicitly stated the pause did not constitute an end to the broader conflict – a distinction markets will be forced to reprice if hostilities resume around April 22.
The macro transmission mechanism here is straightforward: eased Hormuz disruption risk pulled Brent crude back toward $94 per barrel from elevated levels, relieving inflation expectations and reducing the risk-off pressure that had effectively capped Bitcoin price below $70,000 for nearly two weeks.
S&P 500 and Dow futures moved higher in tandem, confirming this was a broad risk-on bid rather than a crypto-specific or safe-haven move.
As Bitcoin’s correlation with macro risk assets has deepened through the Iran conflict, the ceasefire announcement functioned as a simultaneous trigger across asset classes. Riya Sehgal of Delta Exchange noted that the rally’s durability remains uncertain, characterizing Bitcoin as trading as “a high-beta macro asset, sensitive to liquidity, rate expectations, and geopolitical stability.”
The CoinSwitch Markets Desk projected a move toward $75,000 if momentum holds, while flagging $68,000 as near-term support. Analysts broadly described the move as a classic short squeeze layered on a geopolitical relief trade – approximately $400 million in short positions were liquidated in the eight hours following Trump’s announcement, with an additional $270 million unwound in the surrounding 24-hour window.
The broader crypto market cap reached $2.52 trillion at the peak. Ethereum, Solana, XRP, and Dogecoin all posted gains alongside BTC, consistent with a broad risk-appetite recovery rather than Bitcoin-specific accumulation.
Can Bitcoin Price Hold $72,000 After the Ceasefire Rally?
The technical setup entering Tuesday’s session had Bitcoin price range-bound between $66,000 and $70,200 for most of Q1 2026, with the Strait of Hormuz disruptions serving as a persistent ceiling on risk appetite.
The $70,000 level had functioned as a line in the sand for nearly two weeks before the ceasefire announcement cleared it. The Crypto Fear & Greed Index posted an extreme fear reading of 11 on Tuesday, suggesting the market was heavily underpositioned heading into the rally, which partly explains the scale of short liquidations.
Bull case: Iran’s compliance with Hormuz reopening holds through the two-week window, oil stabilizes below $95, and ETF inflows sustain above $400 million per week. Under this scenario, BTC consolidates above $72,000 and targets $75,000, where the next material resistance cluster sits. The invalidation level for this thesis is close to $70,200.
Bear case: Hostilities resume before the two-week window closes, or Iran’s compliance with Hormuz passage proves partial. BTC retraces to $68,269 – the intraday low recorded during Tuesday’s volatile session – with deeper support near $66,000 if risk-off conditions reassert. The fragility of the ceasefire language, with Iran explicitly stating it does not signal an end to the conflict, keeps this scenario non-trivial.
ETF Flows and the Headline-Driven Rally: Is Institutional Demand Confirming the Move?
Spot Bitcoin ETF inflows reached $471 million on April 6, according to available flow data – a meaningful single-day figure that suggests some institutional participation in the relief rally. However, on-chain data simultaneously flagged large-holder selling pressure during the same window, raising the question of whether ETF inflows represent genuine accumulation or tactical positioning ahead of a potential reversal.
The distinction matters. A rally driven primarily by short liquidations and headline sentiment – with institutional sellers distributing into strength – carries a different durability profile than one underpinned by net new demand entering the market.
Iran’s ongoing exploration of alternative payment infrastructure amid the conflict adds a longer-term structural dimension to the geopolitical story, but near-term price action will be determined by whether the ceasefire holds and whether ETF flow data through April 10 confirms the bid. Open interest data will be the next signal to watch: if open interest rebuilds alongside price, that suggests fresh longs entering rather than a pure short-squeeze dynamic.
Until the Strait of Hormuz is demonstrably reopened and the two-week ceasefire survives its first stress test, the current Bitcoin move is more accurately characterized as a geopolitical relief trade than a structural trend change.
Disclaimer: Coinspeaker is committed to providing unbiased and transparent reporting. This article aims to deliver accurate and timely information but should not be taken as financial or investment advice. Since market conditions can change rapidly, we encourage you to verify information on your own and consult with a professional before making any decisions based on this content.
Daniel Frances is a technical writer and Web3 educator specializing in macroeconomics and DeFi mechanics. A crypto native since 2017, Daniel leverages his background in on-chain analytics to author evidence-based reports and deep-dive guides. He holds certifications from The Blockchain Council, and is dedicated to providing "information gain" that cuts through market hype to find real-world blockchain utility.
Standard Chartered has put a $500,000 Bitcoin price target on the table for 2030, and the market nudged higher in response – BTC climbing roughly 100 basis points to $67,500 as the forecast circulated.
The number alone is striking; what’s more telling is that it comes from a bank with a $70 billion balance sheet, not a crypto-native research shop, and that it was delivered without a formal published note to anchor it.
Standard Chartered’s $500K Call: The Institutional Logic Behind the Target
Geoff Kendrick, Standard Chartered’s Global Head of Digital Assets Research, laid out the thesis during an appearance on the Milk Road podcast, citing a 2030 horizon for both Bitcoin at $500,000 and Ethereum at $40,000.
No formal research note has been published to support the figures – the projections aired solely in conversation with host John Gillen, then spread through social clips. That delivery mechanism matters: it’s a view, not a vetted bank forecast, and readers allocating capital on that distinction should note it.
The analytical logic, as Kendrick framed it, rests on Bitcoin’s supply scarcity converging with deepening institutional demand. His model treats Bitcoin as digital gold – with a hard cap of 21 million coins and an addressable market that, if BTC captured gold’s full market capitalization, would imply a per-coin value closer to $1.6 million.
The $500,000 figure is the base case, not the ceiling. A nearer-term checkpoint sits at $100,000 by end-2026, preceded by a potential pullback toward $50,000 if the Federal Reserve holds rates tighter than markets currently price.
This is not Standard Chartered’s first ambitious call. Kendrick forecast $100,000–$200,000 by the end of 2021 following El Salvador’s Bitcoin adoption, and in December 2024, the bank raised its 2025 target to $200,000, citing U.S. election outcomes and spot ETF approvals. The progression from short-cycle trades to decade-long scarcity models reflects how the bank’s conviction has evolved – and how much further out along the risk curve institutional forecasters are now willing to go.
Bitcoin’s 24-hour trading volume rose 16.75% to $18.68 billion on Sunday, according to exchange data, against a market capitalization of approximately $1.35 trillion. That volume uptick alongside a modest price gain suggests the forecast generated sentiment support without triggering a conviction-driven breakout – the market registered the news, not a structural rerating.
The three-scenario frame applied to current levels: in a bull case, Bitcoin price clears resistance near $70,000 on sustained ETF inflows and dollar weakness, putting the $100,000 year-end 2026 checkpoint within range.
The base case holds price in the $65,000–$72,000 band through Q3, with momentum contingent on the Fed’s rate path and spot ETF flow continuity. The bear case – a retreat toward $50,000 – materializes if macro conditions tighten unexpectedly, a scenario Kendrick himself flagged as a likely drawdown before the next leg higher.
Michael Saylor added fuel to the sentiment picture separately, posting his signature orange dot chart on X with the message “Back to Work,” a pattern that has historically preceded large Bitcoin purchase announcements by Strategy. The chart showed Strategy’s holdings at 762,099 BTC. Whether that signals another accumulation tranche is unconfirmed, but the timing alongside the Standard Chartered forecast amplified the bullish narrative cycle.
Disclaimer: Coinspeaker is committed to providing unbiased and transparent reporting. This article aims to deliver accurate and timely information but should not be taken as financial or investment advice. Since market conditions can change rapidly, we encourage you to verify information on your own and consult with a professional before making any decisions based on this content.
Neil is a professional cryptocurrency content writer with years of experience. He has written for various cryptocurrency websites to report on breaking news, and been hired by all sorts of cryptocurrency projects, to create content that would increase their exposure and attract more potential investors.
Charles Schwab is rolling out direct Bitcoin and Ethereum crypto trading to its brokerage client base, a platform that encompasses 38.9 million active accounts and $12.22 trillion in client assets – in a phased launch beginning in the second quarter of 2026.
The offering, branded Schwab Crypto and operated through Charles Schwab Premier Bank, SSB, marks a structural departure from the firm’s prior crypto exposure model, which routed clients through ETFs, futures, and crypto-adjacent equities.
The significance is not merely product expansion. It is a test of whether direct digital asset ownership can integrate into the workflow of a mainstream brokerage customer at scale – and whether that integration generates the kind of demand signal that reshapes competitive dynamics across the retail brokerage industry.
🚨CHARLES SCHWAB TO LAUNCH SPOT BTC & ETH
Charles Schwab plans to roll out spot BTC and ETH trading in the first half of 2026 via its Premier Bank unit.
This enables the $11.9T platform's users to trade crypto alongside traditional assets as it competes with major exchanges. pic.twitter.com/eBBrO3lTJw
Schwab Crypto Structure: Breaking Down the Implementation Mechanics
Schwab Crypto does not live inside the existing brokerage account.
Qualifying clients will access direct BTC and ETH trading through a dedicated account tied to the firm’s affiliated banking subsidiary – a structural boundary that separates crypto holdings from the stocks, bonds, and ETFs clients already hold under SIPC coverage. Crypto assets held through the new product carry neither SIPC nor FDIC protection, a disclosure Schwab is making explicit in its rollout materials.
The initial cohort is narrow by design. The pilot begins with Schwab employees, followed by a small early-access group drawn from a waitlist currently open on Schwab’s crypto page, before broadening through the remainder of the first half of 2026.
Geographic restrictions apply at launch: the product is available across all U.S. states except New York and Louisiana. Asset scope is limited to Bitcoin and Ethereum only, with no additional cryptocurrencies announced.
Feature depth at launch is also deliberately constrained. Schwab currently accepts no external crypto deposits and does not support withdrawals to self-custody wallets, staking, recurring purchases, or limit orders – capabilities that distinguish native crypto platforms from this initial brokerage integration. Pricing and fee structure have not been publicly disclosed ahead of the pilot. The product, as structured, is a basic buy-and-sell interface sitting inside one of the largest financial institutions in the United States.
That simplicity is the point. Schwab is not competing with Coinbase on feature depth. It is testing whether the mere availability of direct ownership – inside a familiar brokerage interface, for a client base that already trusts Schwab with their retirement savings – generates measurable demand distinct from what ETF flows have already revealed.
Disclaimer: Coinspeaker is committed to providing unbiased and transparent reporting. This article aims to deliver accurate and timely information but should not be taken as financial or investment advice. Since market conditions can change rapidly, we encourage you to verify information on your own and consult with a professional before making any decisions based on this content.
Neil is a professional cryptocurrency content writer with years of experience. He has written for various cryptocurrency websites to report on breaking news, and been hired by all sorts of cryptocurrency projects, to create content that would increase their exposure and attract more potential investors.