The crypto market is splitting into two. Bitcoin price is struggling to hold above $69,000. Ethereum and XRP are retracing. Solana and Cardano are bleeding. The Fed’s hawkish rate comments sent BTC back toward lower support zones and dragged most of the altcoin market with it.
Then there is Siren. The AI-focused token surged 90% to a new all-time high above $1.70 while everything else was selling off. Liquidity is not leaving the market. It is rotating fast into specific narratives and bypassing everything else.
The broader market is in suspended animation. Siren is not.
Can Bitcoin Price Hold Support Amid $68,000 Consolidation?
Bitcoin is currently trading in a light bullish consolidation phase, hovering between US$69,000 and US$67,000 as of late March.
Bulls have struggled to break the $76,000 ceiling, resulting in a short-term pullback where profit-taking has capped gains. The key support level remains firm at the $69,000–$68,000 range; a breach here could expose lower liquidity zones around $66,000, drastically shifting market structure.
Ethereum (ETH)
24h7d30d1yAll time
Prediction markets reflect this uncertainty. Data from Robinhood prediction markets show bearish bets accumulating, suggesting skepticism about an immediate breakout above $80,000.
Conversely, a clean break above $77,000 targets the $79,000–$82,000 corridor, but volume has yet to confirm this move.
The altcoin sector mirrors this indecision. Ethereum has slipped below $2,100, while legacy assets like Zcash have shed 7%. Even with Dogecoin signaling potential reversals, the immediate trend for major alts remains heavily correlated to Bitcoin’s inability to reclaim the $76,000 high.
Disclaimer: Coinspeaker is committed to providing unbiased and transparent reporting. This article aims to deliver accurate and timely information but should not be taken as financial or investment advice. Since market conditions can change rapidly, we encourage you to verify information on your own and consult with a professional before making any decisions based on this content.
Daniel Frances is a technical writer and Web3 educator specializing in macroeconomics and DeFi mechanics. A crypto native since 2017, Daniel leverages his background in on-chain analytics to author evidence-based reports and deep-dive guides. He holds certifications from The Blockchain Council, and is dedicated to providing "information gain" that cuts through market hype to find real-world blockchain utility.
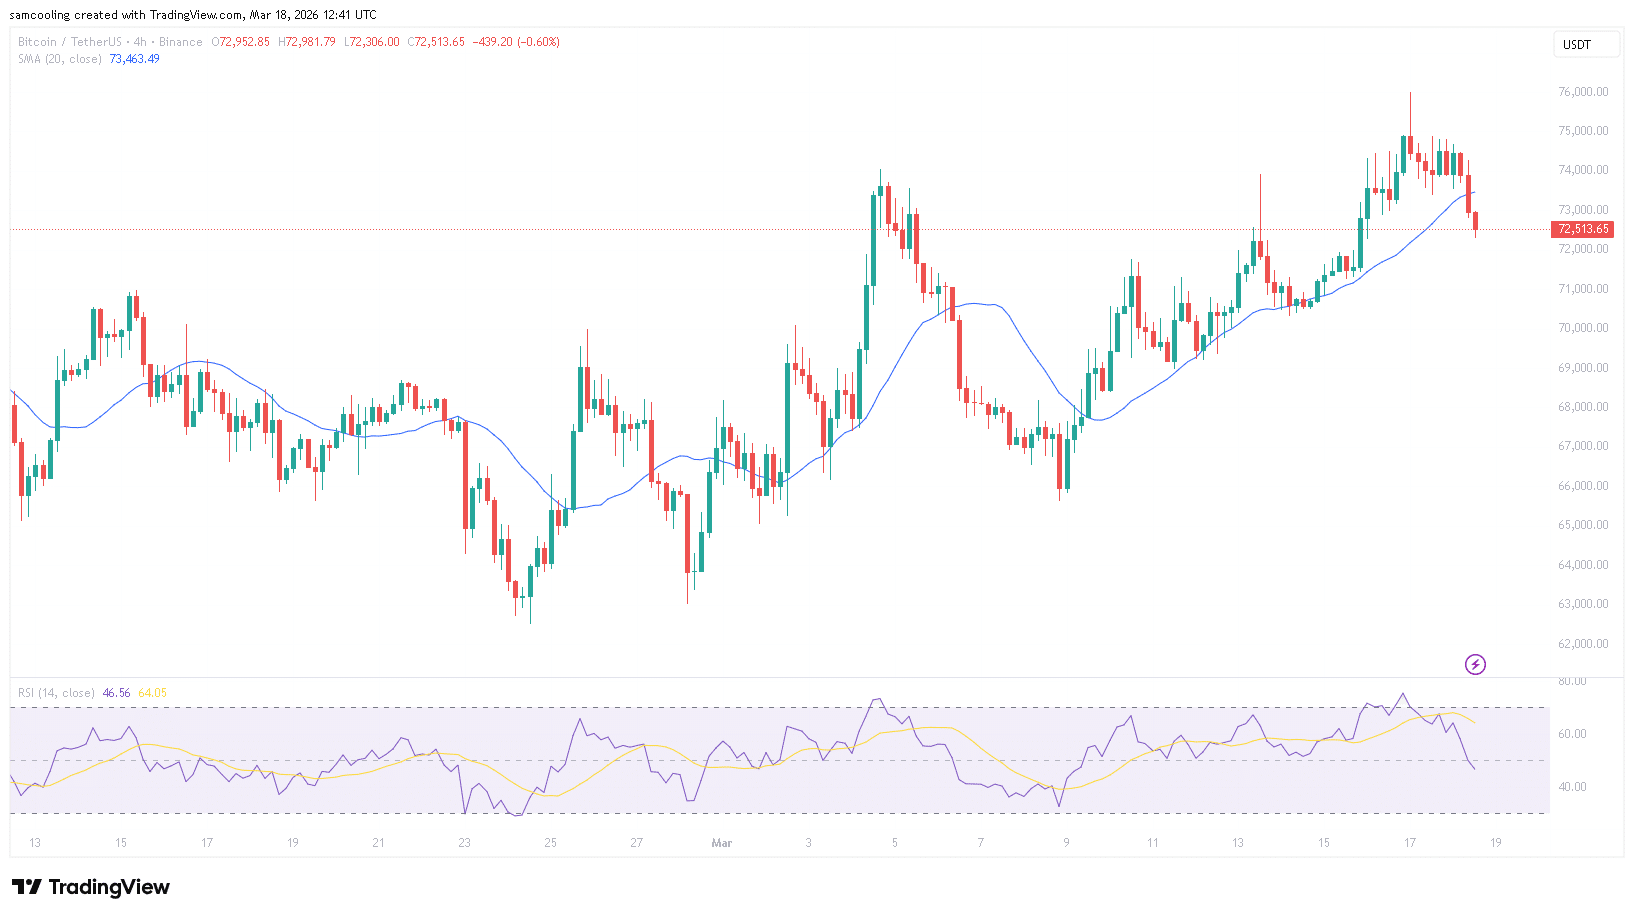
Bitcoin (BTC) is trading near $72,400, consolidating cautiously as the Federal Open Market Committee (FOMC) prepares to release its critical policy decision. This monetary pivot point effectively determines the near-term cost of capital, dictating whether risk assets face a liquidity drought or a renewed expansion phase. Traders are currently bracing for a major move, with technical indicators signaling a binary resolution that risks a structural breakdown to $55,000 or a massive crypto volatility breakout targeting $170,000.
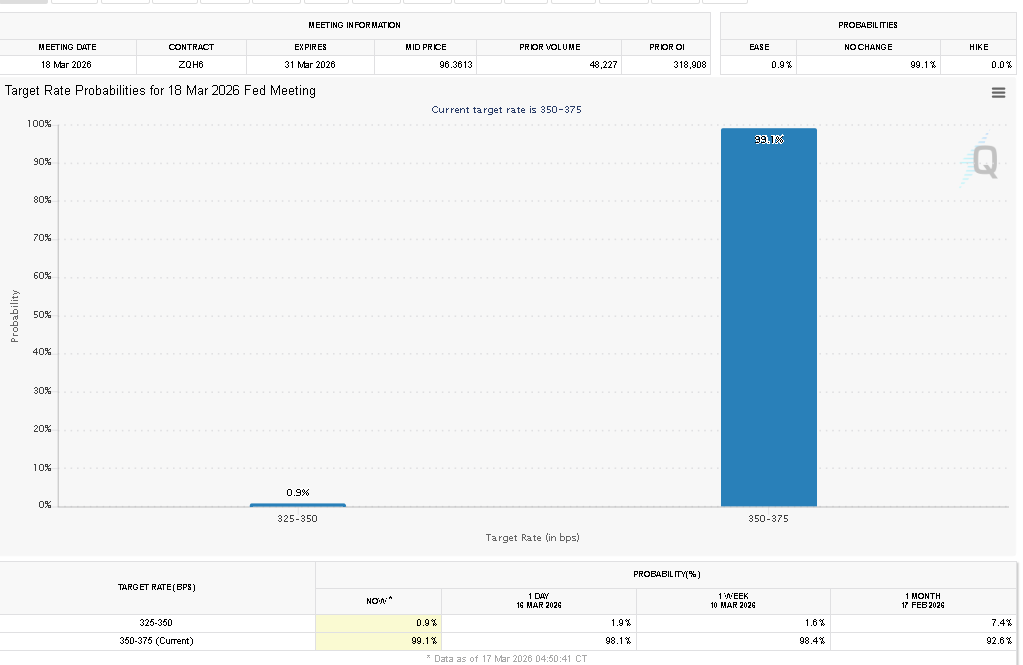
The market is currently pricing in a high probability that the Federal Reserve will maintain interest rates within the 3.50% to 3.75% target range, but the accompanying Statement of Economic Projections (SEP) remains the primary variable. With inflation data presenting a mixed picture due to recent energy sector volatility, the tone of Chairman Jerome Powell’s press conference will likely serve as the directional trigger. The binary is clear: a dovish pivot validates the current bull flag accumulation, while a hawkish hold threatens to unwind months of institutional inflow.
The relationship between Fed interest rates and Bitcoin price action operates primarily through the liquidity channel. When the Fed maintains a restrictive stance, higher yields on risk-free Treasury assets increase the opportunity cost of holding non-yielding assets like Bitcoin. Conversely, when the Fed signals easing, the cost of capital falls, forcing investors to move further out on the risk curve in search of yield. This mechanic is critical for the current setup, as Bitcoin has recently displayed a negative correlation of -0.43 with the S&P 500, suggesting it is reacting more directly to monetary conditions than to general equity sentiment.
Three distinct scenarios face the market. In a hawkish scenario, the Fed emphasises persistent service inflation and delays projected cuts, effectively tightening liquidity conditions and strengthening the US Dollar Index (DXY). In a neutral scenario, rates are held steady with balanced language, likely keeping Bitcoin range-bound. In a dovish scenario, acknowledgement of banking-sector stress or progress toward disinflation could signal the start of a liquidity-injection cycle. According to CME FedWatch data, markets are currently split on the timing of the next cut, making the dot-plot forward guidance the decisive factor for capital allocation.
This macro-transmission mechanism sets the stage for a volatile technical resolution, with volatility compression reaching historical extremes.
Bollinger Band Width Signals Volatility Expansion: The $55K–$170K Range
The technical structure for Bitcoin price is currently defined by a historic compression in Bollinger Band width, a phenomenon known as a “squeeze” that typically precedes significant price expansion. Analysts note that the current consolidation has coiled price action tightly around the 20-day moving average, creating a dormant volatility setup that demands a release. Based on historical data, periods of such low volatility often resolve in moves exceeding 20-30% in either direction.
Mapping this technical setup against the FOMC backdrop reveals distinct price targets. In a bearish outcome driven by hawkish policy, a failure to hold the mid-band would target the lower Bollinger Band, which aligns structurally with the $55,000 support zone. Conversely, a bullish resolution would see price “walking the bands” upward. If volatility expands to the upside, Fibonacci extension levels derived from the current consolidation pattern project a long-term Bitcoin price prediction target as high as $170,000. The immediate confirmation level for traders remains the upper band resistance near $78,000; a daily close above this level confirms the breakout thesis.
Hawkish FOMC: The Path to $55,000 and Lower Band Support
A hawkish outcome would likely manifest as the Fed holding rates steady while revising the “dot plot” to show fewer cuts in 2026 than previously anticipated. Specifically, if Chair Powell cites elevated core PCE numbers or tight labor market conditions as justification for a “higher for longer” stance, the immediate reaction would likely be a spike in the 10-year Treasury yield. This repricing would drain liquidity from risk assets, effectively forcing Bitcoin to test lower support levels.
Technically, this scenario triggers a rejection at the Bollinger Band basis. If Bitcoin loses the psychological $70,000 handle on closing volume, the path of least resistance shifts toward the lower band extremities. Analysts identify the $55,000 region as the critical structural floor—a level that represents a full retracement of the recent pre-FOMC speculative rally. Confirmation of this bearish trend would be a spike in the DXY above 104, inversely correlating with a breakdown in crypto assets. The invalidation for this bearish thesis would be a rapid reclamation of the $72,000 level immediately following the press conference.
Dovish Signal or Volatility Breakout: The Case for $170,000
The bullish case for a volatility breakout rests on the Federal Reserve signaling a dovish pivot, potentially by acknowledging risks to financial stability or softening its inflation language. Such a signal would likely compress real yields, driving capital into hard assets as a hedge against monetary debasement. Under this scenario, the inverse correlation with the dollar acts as a tailwind, effectively unlocking the liquidity needed to sustain a push toward new all-time highs.
From a technical perspective, a dovish catalyst would likely force a decisive close above the upper Bollinger Band, currently constraining price near $78,000. Phemex analysis suggests that a breakout here, accompanied by significant spot volume, opens the door to price discovery. The measured move from this multi-month consolidation, when extrapolated via Fibonacci extensions, places the cycle peak target near $170,000. Intermediate resistance lies at the psychological $100,000 level, where significant sell-side liquidity is likely clustered. For this scenario to remain valid, Bitcoin must maintain support above $74,000 throughout the initial volatility event.
FOMC Institutional Flow Implications: ETF Positioning and Volatility Pricing
Institutional positioning ahead of the decision suggests smart money is hedging against extreme variance rather than betting on a single direction. Recent data indicates that spot Bitcoin ETFs, including key products from BlackRock and Fidelity, have seen mixed flows, with a notable accumulation trend from whales, evidenced by a recent transfer of over 1,900 BTC from exchanges. However, the options market tells a more cautious story; implied volatility is elevated, indicating that traders are paying a premium to protect against outsized moves.
This positioning structure implies that a “sell-the-news” event is less likely, given the existing caution. Instead, the market is primed for a “volatility crush” if the Fed delivers a neutral verdict, or a directional squeeze if a surprise occurs. If the FOMC decision aligns with the consensus of a hold without hawkish rhetoric, the probability of a grind higher increases, as hedged positions are unwound. Conversely, a surprise rate adjustment would catch a significant portion of the market offside, fueling the volatility breakout described in the technical setups.
Until the Federal Reserve clarifies its stance via the Statement of Economic Projections, the probability of range-bound volatility remains elevated, effectively capping Bitcoin’s immediate upside near resistance levels. Traders will be scrutinizing the specific language regarding the timeline for future rate cuts; any deviation from the expected mid-year timeline will likely serve as the catalyst that resolves the current Bollinger Band squeeze into a directional trend.
Disclaimer: Coinspeaker is committed to providing unbiased and transparent reporting. This article aims to deliver accurate and timely information but should not be taken as financial or investment advice. Since market conditions can change rapidly, we encourage you to verify information on your own and consult with a professional before making any decisions based on this content.
Daniel Frances is a technical writer and Web3 educator specializing in macroeconomics and DeFi mechanics. A crypto native since 2017, Daniel leverages his background in on-chain analytics to author evidence-based reports and deep-dive guides. He holds certifications from The Blockchain Council, and is dedicated to providing "information gain" that cuts through market hype to find real-world blockchain utility.
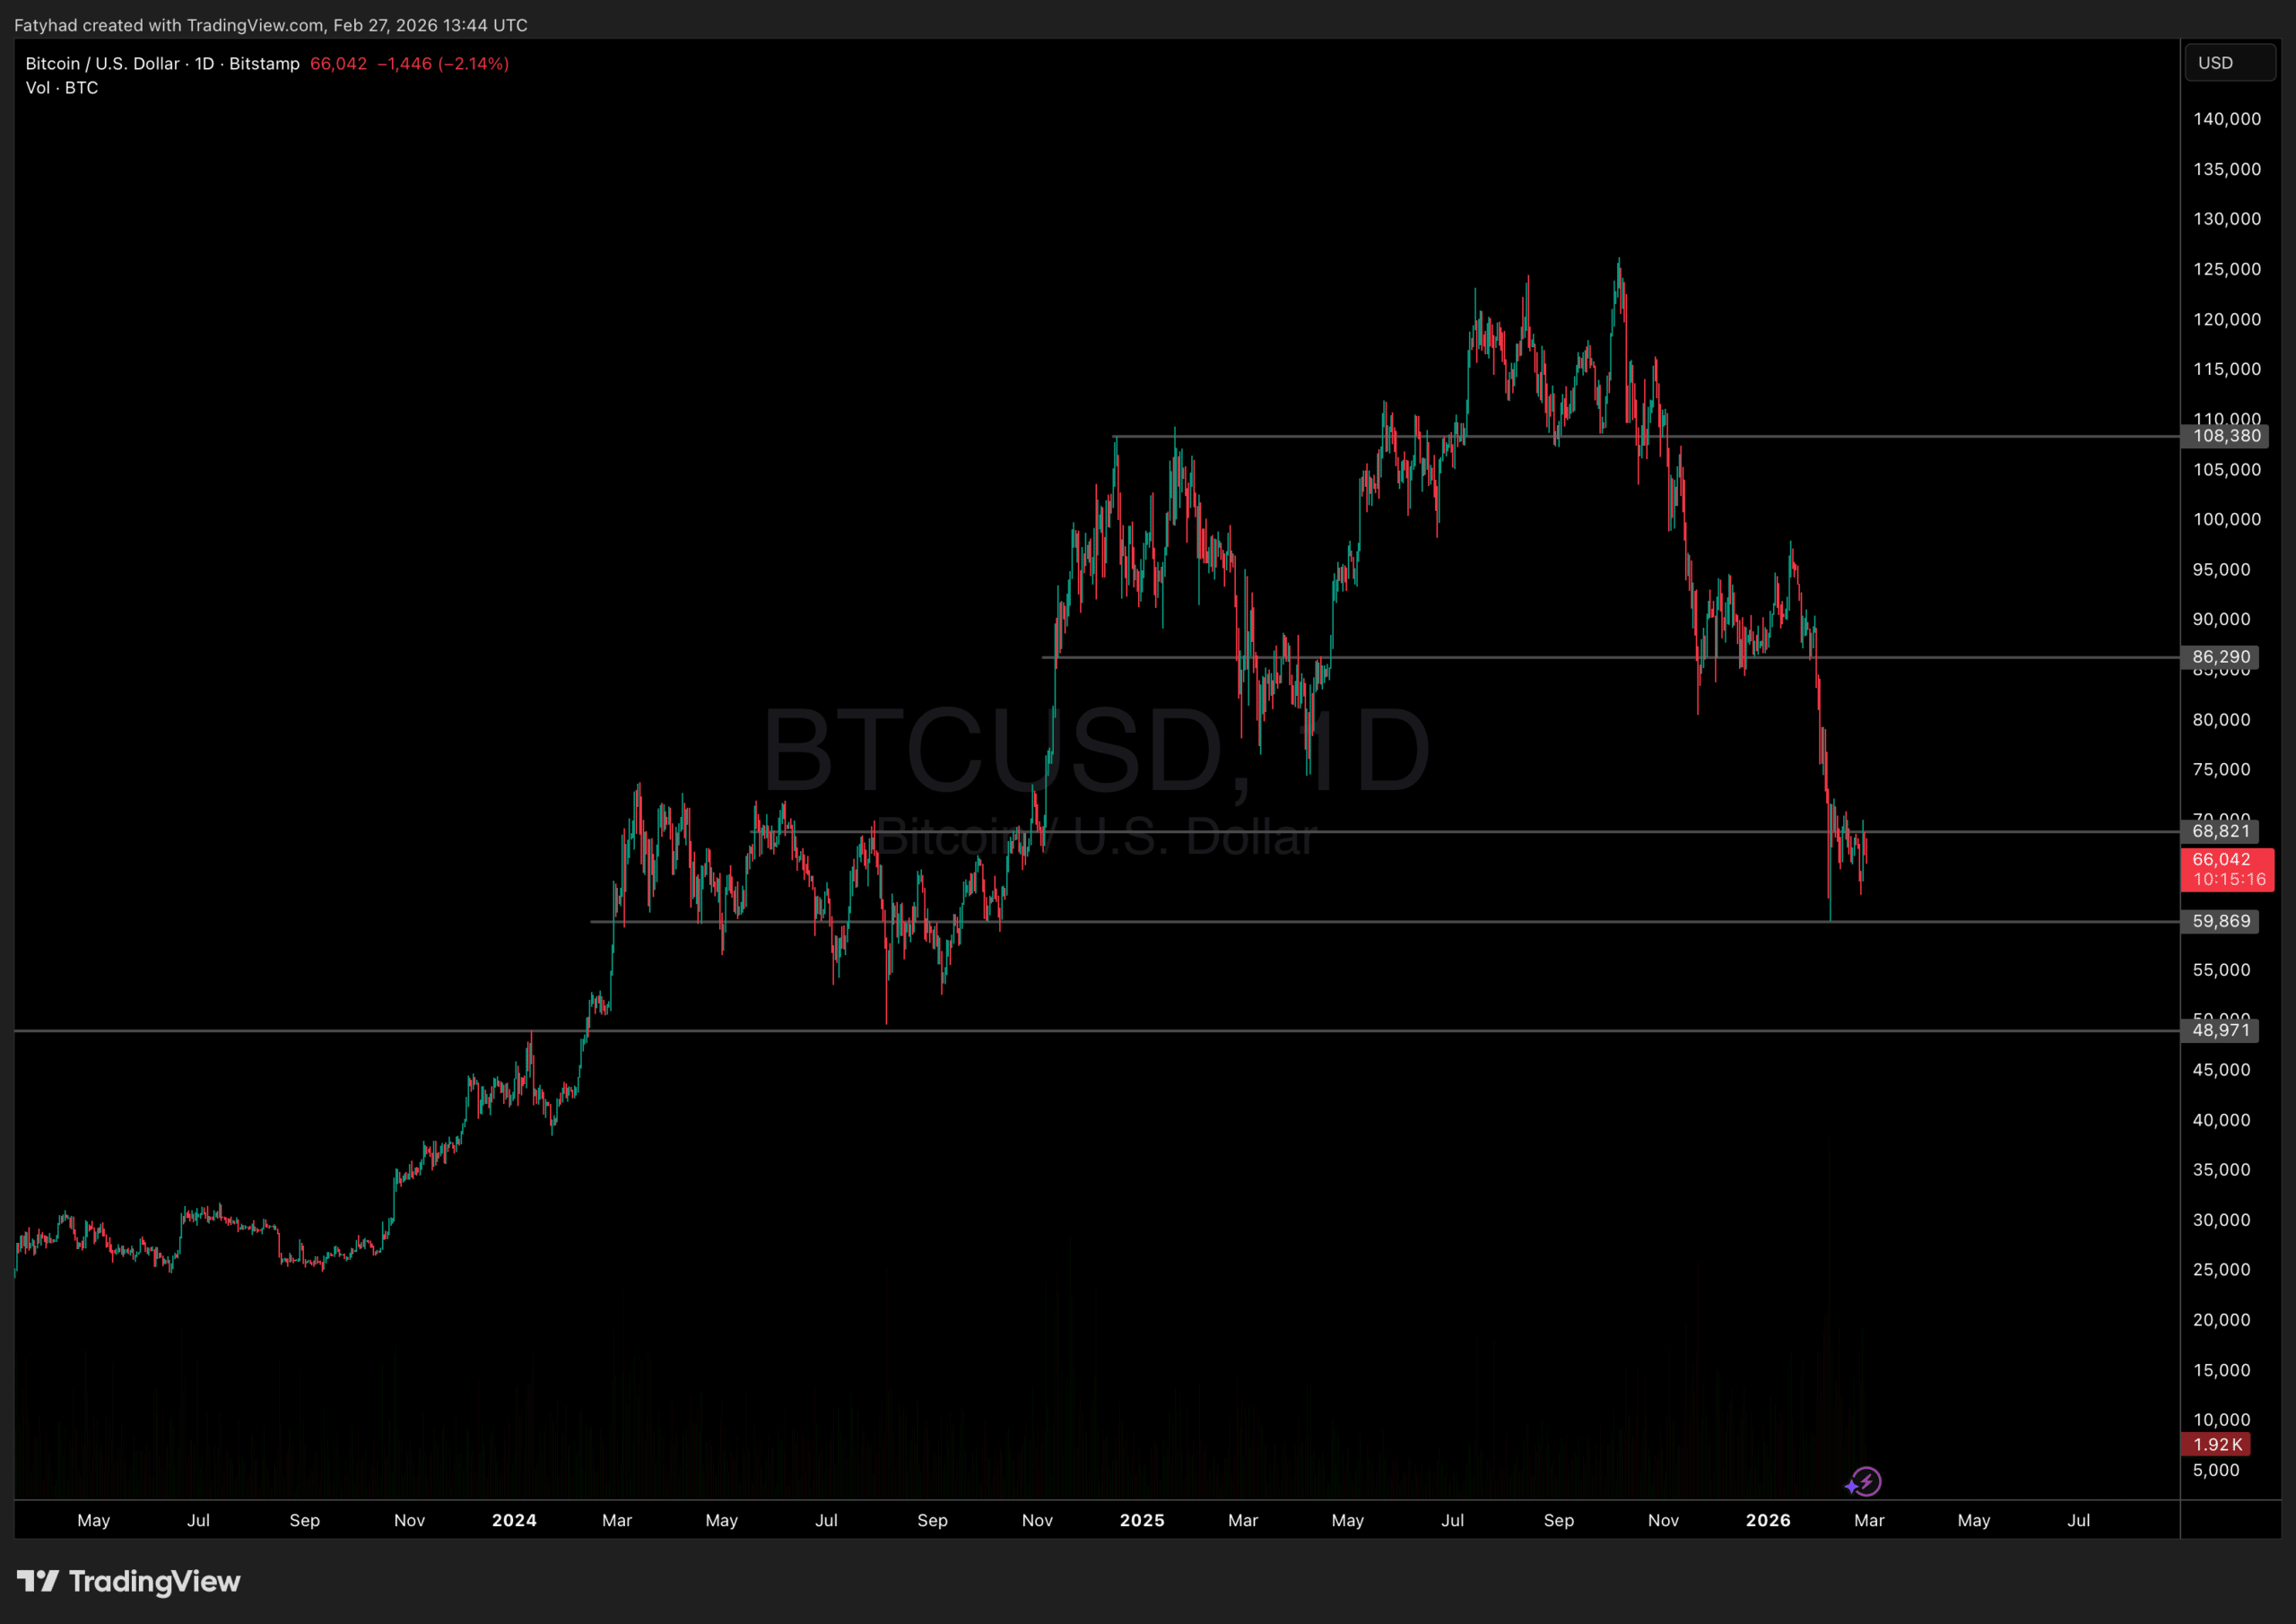
Bitcoin heads into March 2026 on shaky ground fueling bearish price prediction.
After a brutal 15% February drop and five straight red monthly candles since October 2025, BTC is now drifting between $66,500 and $67,200. The chart is shaping into a clean bear flag, with technical pressure pointing toward a possible move down to $56,000 if support gives way.
Correlation with US equities is not helping. Stocks are under pressure from tariffs and geopolitical tension, and Bitcoin is moving with them instead of acting independently.
March now becomes decisive. Breakdown confirms continuation lower. Hold and reverse, and this correction may end up being the reset before the next major leg.
Bitcoin Price Prediction: Bear Flag Formation, Technical Breakdown Targets $56,000
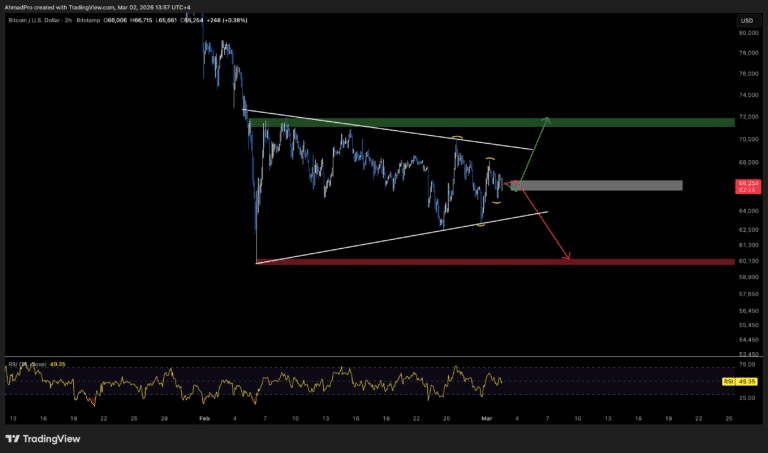
On the weekly charts, Bitcoin is printing a clean bear flag. The sharp drop from $90,000 formed the pole. The sideways grind between $64,000 and $69,000 is the flag. That structure usually resolves in the direction of the prior move, which is down.
The key level is $62,300. A confirmed breakdown below that support validates the pattern and opens the door to $56,800 as the measured move. If panic accelerates, extreme scenarios stretch toward $41,400. Volume backs the bearish case. Relief bounces are coming on weaker participation, and RSI remains below 50, keeping momentum tilted to sellers.
To flip this structure, bulls must reclaim $79,000 on a daily close. That would break the lower-high sequence and push price back above the 50-day SMA near $77,200. Until that happens, rallies are suspect.
The macro backdrop is not helping. Bitcoin just logged five consecutive red months, echoing prior deep correction phases. The Fear & Greed Index is stuck in Extreme Fear, and US spot ETFs have seen four straight months of net outflows. That signals institutional de-risking, not accumulation.
Correlation with the S&P 500 remains elevated around 0.55, undermining the hedge narrative. As long as Bitcoin trades like a tech proxy, it stays vulnerable to broader risk-off waves.
For March, three signals matter. First, $62,300. Lose it with volume and continuation likely follows. Second, ETF flows. A decisive shift back to net inflows would hint at institutional stabilization. Third, correlation. If equities slide but Bitcoin holds firm, that decoupling could mark a turning point.
Can ETF Inflows Still Trigger a Rally to $110,000?
Not everyone is bearish.
A group of macro analysts, including Henrik Zeberg, argues this correction is setting up a final “risk-on” expansion. In that scenario, exhaustion around the $60,000 zone marks the bottom, and Bitcoin rebounds sharply toward $110,000 to $120,000 in a V-shaped move.
This is the setup for the strongest Risk-On Scenario in a long time!
The thesis hinges on institutions. Retail flows have weakened, but long-term holders are not distributing aggressively. If ETF issuers and corporate treasuries resume steady accumulation, the already tight supply could amplify upside quickly.
The trigger is simple: ETF flows must flip. After four straight months of outflows, a sustained return to strong net inflows would shift psychology. A weekly addition exceeding roughly 2,000 BTC would likely signal that accumulation has resumed.
Until that flow dynamic changes, the bullish macro case remains conditional rather than active.
Can Bitcoin Hyper’s Layer-2 Infrastructure Offer a Hedge Against March Volatility?
As spot BTC price action remains under pressure from the bear flag setup, some seasoned investors are diversifying into Layer-2 infrastructure that benefits from Bitcoin’s ecosystem growth regardless of short-term price direction. Bitcoin Hyper (HYPER) has emerged as a focal point for this thesis, attracting capital with its promise to bring high-speed DeFi utility directly to the Bitcoin network.
Bitcoin Hyper leverages the Solana Virtual Machine (SVM) to create a high-throughput Layer-2 specifically for Bitcoin. This architecture allows for rapid transaction processing and low fees while settling finality on the Bitcoin blockchain. By bridging the gap between Ethereum-style programmability and Bitcoin’s security, Hyper aims to unlock the trillion-dollar dormant capital currently sitting in BTC wallets.
The project is currently in its presale phase, having already raised over $31 million from early strategic investors. The token is priced in stages to reward early adopters, with the current tranche offering entry before the next scheduled price increase.
Security remains a priority, with the smart contracts fully audited by Coinsult and SpyWolf. Additionally, the protocol offers staking rewards, allowing investors to earn yield on their holdings while the mainnet development concludes.
For investors looking to hedge against spot price chop, infrastructure plays like Bitcoin Hyper offering a way to bet on the long-term transactional utility of the network.
Join the Bitcoin Hyper community on Telegram and X.
Disclaimer: Coinspeaker is committed to providing unbiased and transparent reporting. This article aims to deliver accurate and timely information but should not be taken as financial or investment advice. Since market conditions can change rapidly, we encourage you to verify information on your own and consult with a professional before making any decisions based on this content.
Daniel Frances is a technical writer and Web3 educator specializing in macroeconomics and DeFi mechanics. A crypto native since 2017, Daniel leverages his background in on-chain analytics to author evidence-based reports and deep-dive guides. He holds certifications from The Blockchain Council, and is dedicated to providing "information gain" that cuts through market hype to find real-world blockchain utility.
BTC price is trading around $66,000, down roughly 3% in the last 24 hours. It briefly approached $70,000 earlier this week but failed to hold, slipping toward $66,000 amid renewed selling pressure.
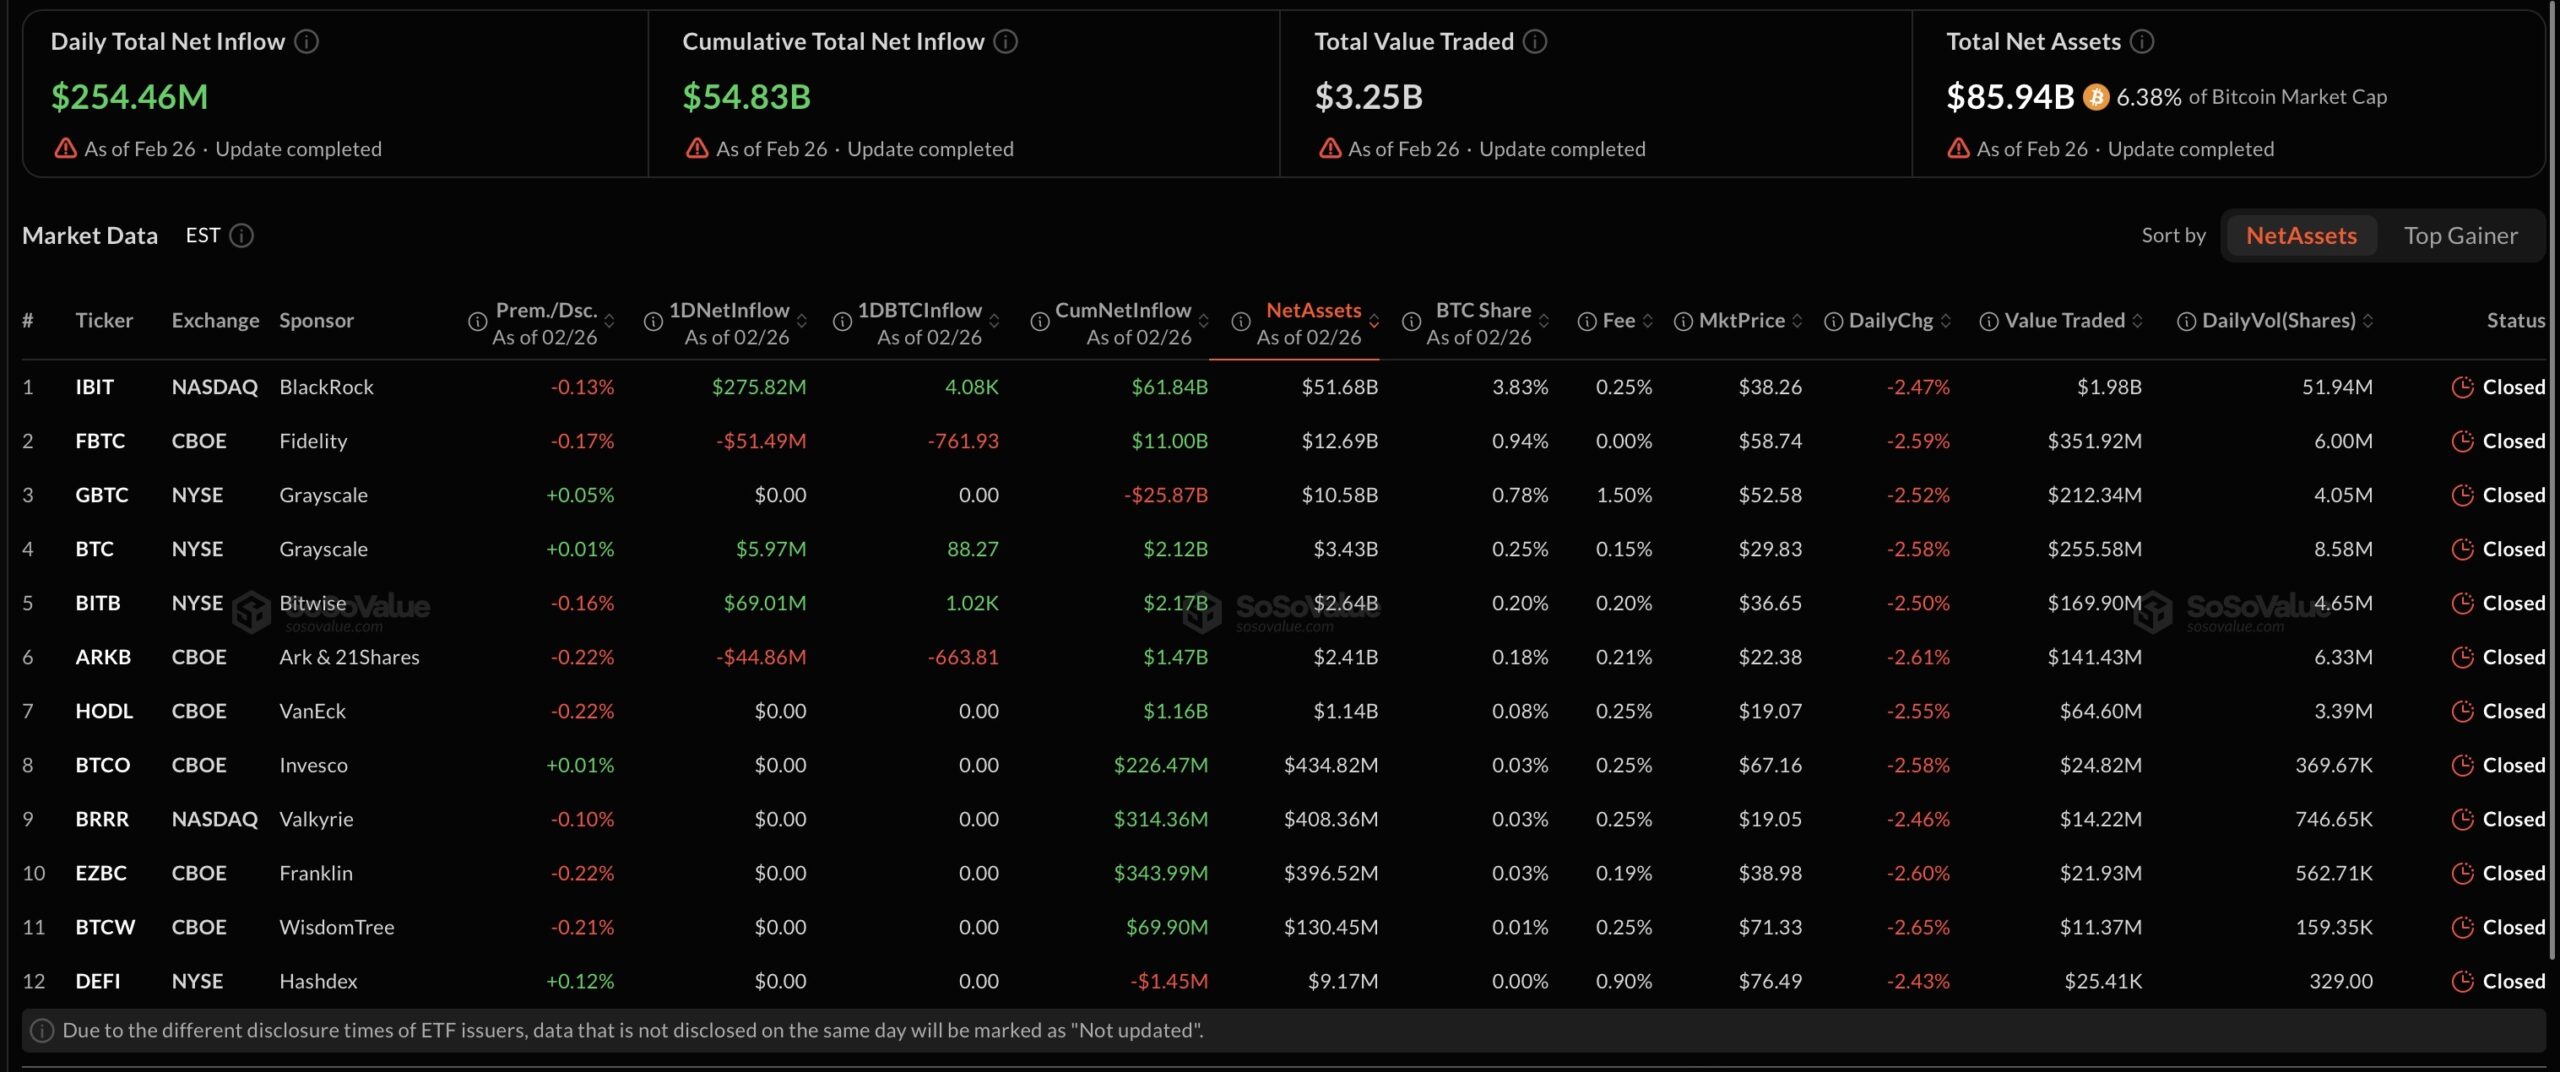
US spot Bitcoin ETFs saw $507 million in net inflows the prior day, with BlackRock’s IBIT alone taking in nearly $300 million, and over $200 million today but the price hasn’t followed suit. Despite strong institutional buying, this disconnect shows institutions accumulating steadily while retail traders and leveraged players take profits at key resistance levels like $67K–$70K.
While Bitcoin price drops often correlate with outflow cycles, the current scenario suggests that aggressive buying from issuers like BlackRock is currently absorbing sell-side liquidity rather than driving an immediate breakout.
On February 26 (ET), spot Bitcoin ETFs recorded a total net inflow of $254 million, marking three consecutive days of net inflows. Spot Ethereum ETFs saw a total net inflow of $6.5742 million, also extending their streak to three consecutive days of net inflows.… pic.twitter.com/VMvq5Wv3Ui
Data from tracking firms confirms that February 26 marked a significant resurgence in institutional demand. U.S. spot Bitcoin ETFs saw a collective net inflow of approximately $507 million, ending a brief period of stagnation. BlackRock’s IBIT was the dominant driver, recording inflows of $297.37 million. This activity coincided with significant on-chain movements detected by blockchain analytics platforms.
Lookonchain identified that BlackRock transferred 4,309 BTC, valued at roughly $289 million, from Coinbase Prime hot wallets to its custody addresses within a single hour.
This volume represents one of the strongest single-day accumulation efforts by the asset manager in weeks. The mechanics of the transfer involved multiple batches of approximately 300 BTC each, executed with algorithmic precision to minimize slippage.
Despite the scale of this capital deployment, which effectively removed thousands of coins from circulation, the BTC price reacted with a muted decline, suggesting that this demand was met by an equal or greater wall of supply.
Bitcoin is currently consolidating within a tightening range, with immediate focus on the $66,000 support level. Technical indicators suggest that momentum is resetting after the recent rejection near $69,000. The 4-hour chart shows the price hovering near the 50-period moving average, a zone that has historically acted as a dynamic pivot for short-term trends.
Immediate resistance sits at $68,800 to $69,000. A clean break and daily close above this zone would invalidate the short-term bearish divergence currently visible on the RSI (Relative Strength Index). Conversely, if bears manage to push the price below $66,500, the next major area of interest lies at $64,000, where significant demand liquidity historically resides.
If bulls can reclaim the $68,000 midpoint, it would signal that the market has fully digested the recent selling pressure.
As BlackRock Accumulates, Bitcoin Hyper Expands the Ecosystem
While BlackRock consolidates the spot Bitcoin market, new projects are emerging to leverage the asset’s liquidity and brand in novel ways. Bitcoin Hyper is positioning itself as a high-utility bridge between the security of Bitcoin and the flexibility of Ethereum’s DeFi ecosystem.
Bitcoin Hyper serves as a layer that enables Bitcoin holders to engage with decentralized finance without sacrificing the security of their core holdings. By utilizing an ERC-20 token structure, the project offers faster transaction speeds and lower costs compared to the native Bitcoin network, while still tethering its narrative value to the BTC ecosystem.
The HYPER project has successfully raised over $31 million with tokens currently trading at $0.0136762. Further increases are planned and exchange listings are expected in 2026.
The roadmap also outlines the launch of a dedicated staking platform and integration with major DeFi protocols.
Disclaimer: Coinspeaker is committed to providing unbiased and transparent reporting. This article aims to deliver accurate and timely information but should not be taken as financial or investment advice. Since market conditions can change rapidly, we encourage you to verify information on your own and consult with a professional before making any decisions based on this content.
Daniel Frances is a technical writer and Web3 educator specializing in macroeconomics and DeFi mechanics. A crypto native since 2017, Daniel leverages his background in on-chain analytics to author evidence-based reports and deep-dive guides. He holds certifications from The Blockchain Council, and is dedicated to providing "information gain" that cuts through market hype to find real-world blockchain utility.